WANT TO LEARN HOW TO DESIGN SUCH BEAUTIFUL REPORTS
YOURSELF?
YOURSELF?
Get our FREE ebook on the best practices in data visualization:


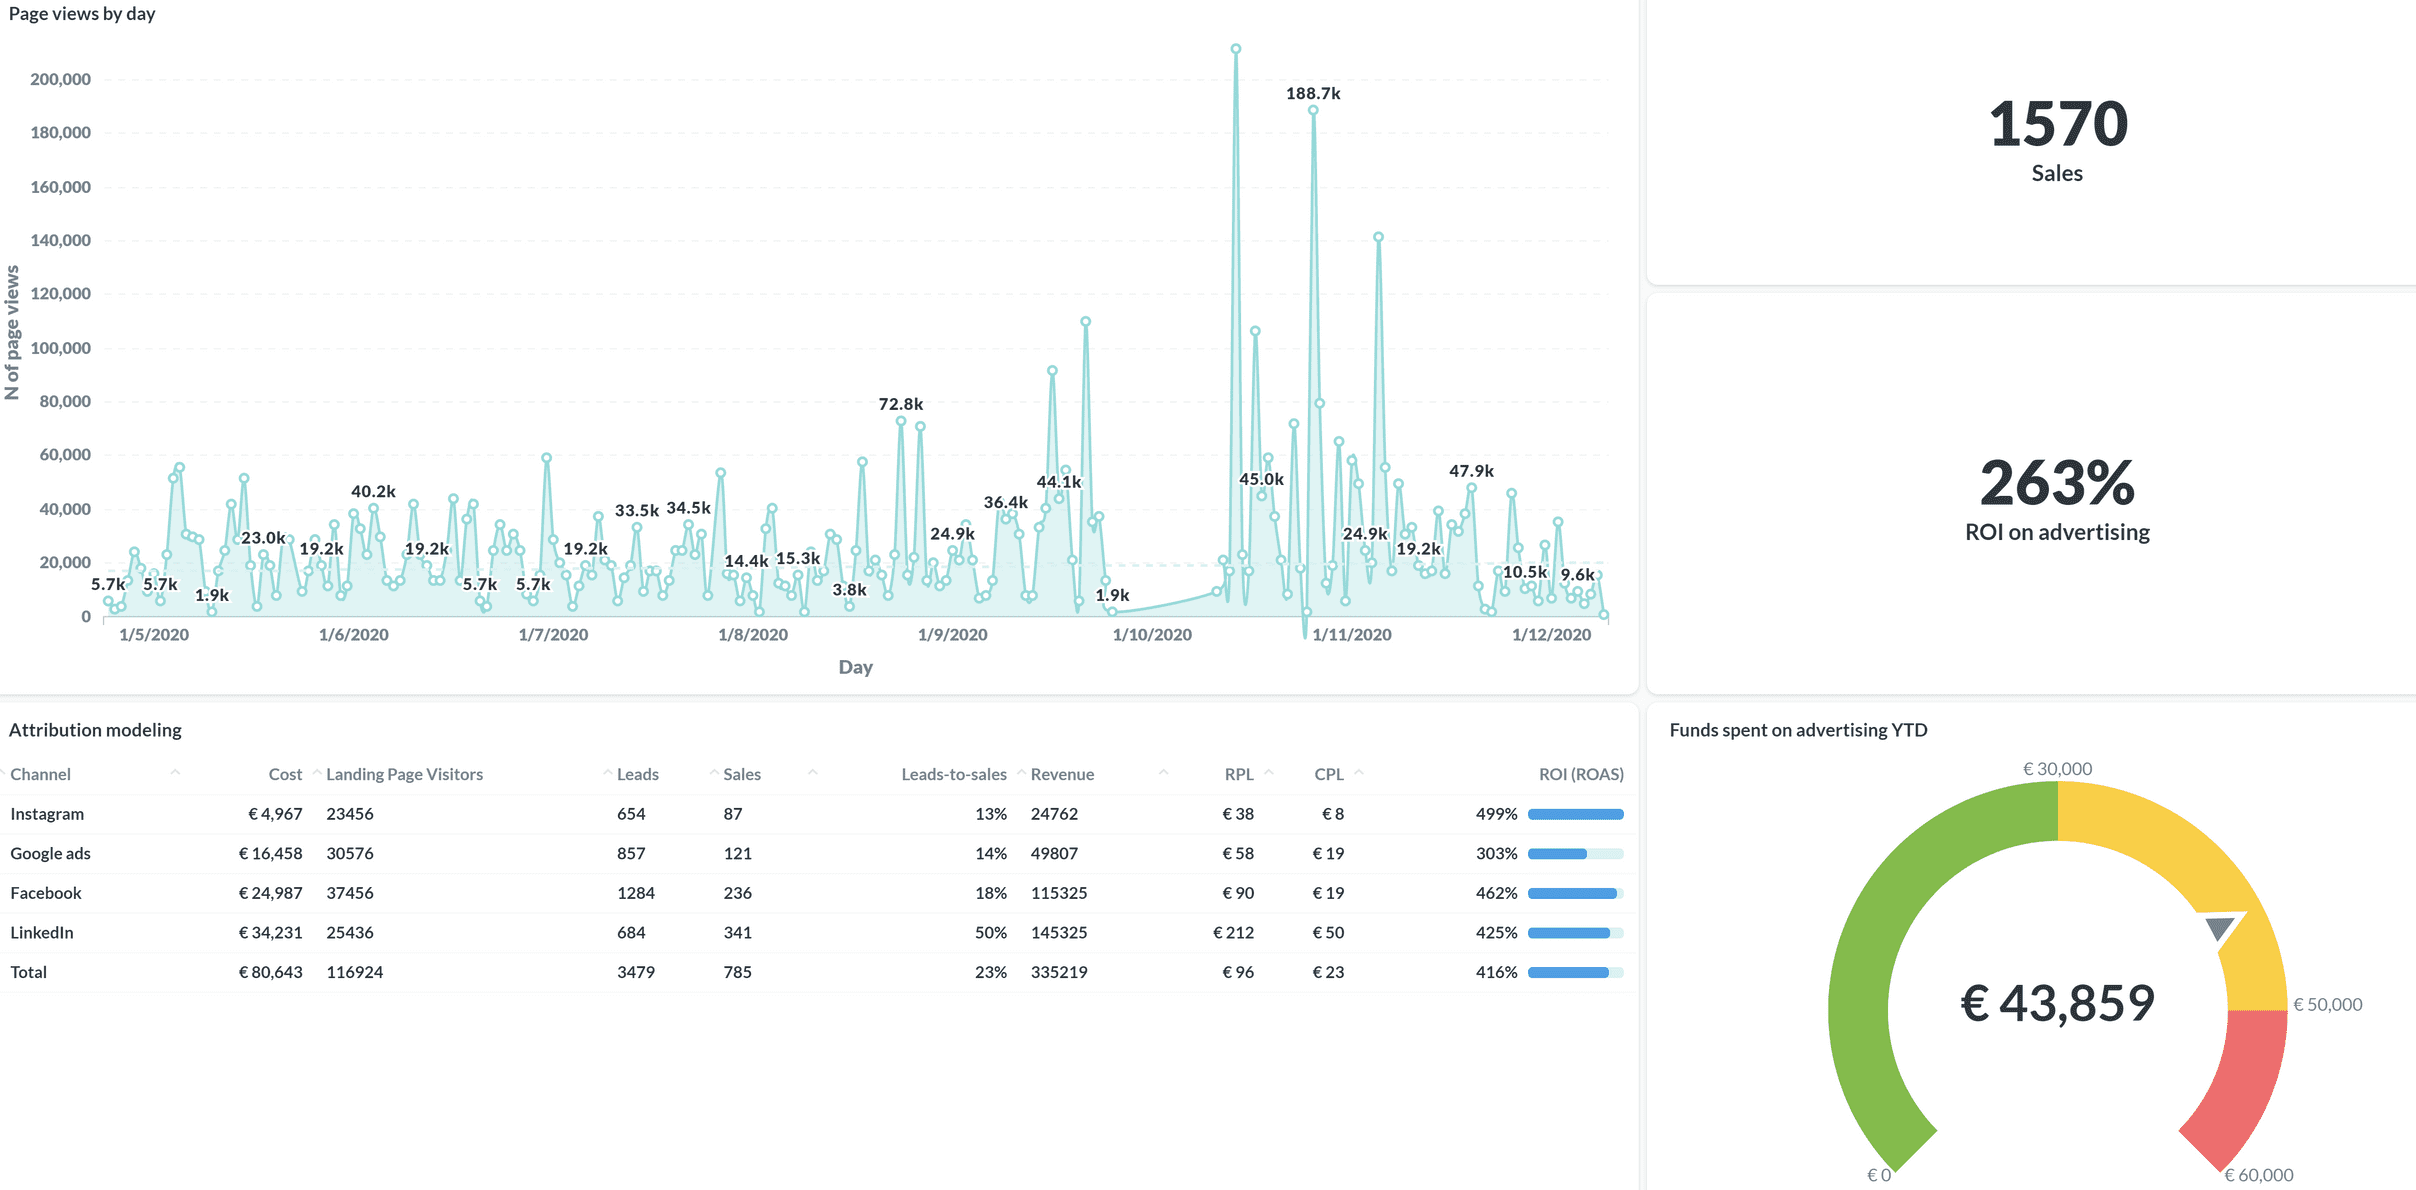
A Marketing Report is a report that is focused on the performance measurements associated with the Marketing and Advertising activities. ROAS (Return on Advertising Spend) is a key focus of many Marketing reports. Much like the ROI%, ROAS aims to measure the efficiency and effectiveness of the Marketing Investments, whether it is CPC spend or spend on TV Advertising. One of the more popular variations of the Marketing Report(s) is a Digital Ad Spend Marketing Report. This report focuses exclusively on the effectiveness of the digital advertising with the goal to invest ad budget into online channels which bring the best customers. Measuring the effectiveness of a channel is a combination between the volume of traffic the channel brings, the conversion rate of that traffic, and the CLV (Customer Lifetime Value) of the converted cohorts. There are many intermediate metrics – such that help us get insights into how well the different components of our marketing efforts are performing. Having a well-constructed, automated and accurate marketing report is crucial for every marketing manager (and business owner) who wants to make data-driven decisions and see the real impact of the marketing investment.
At SageData you always own your data, we help you make sense of it
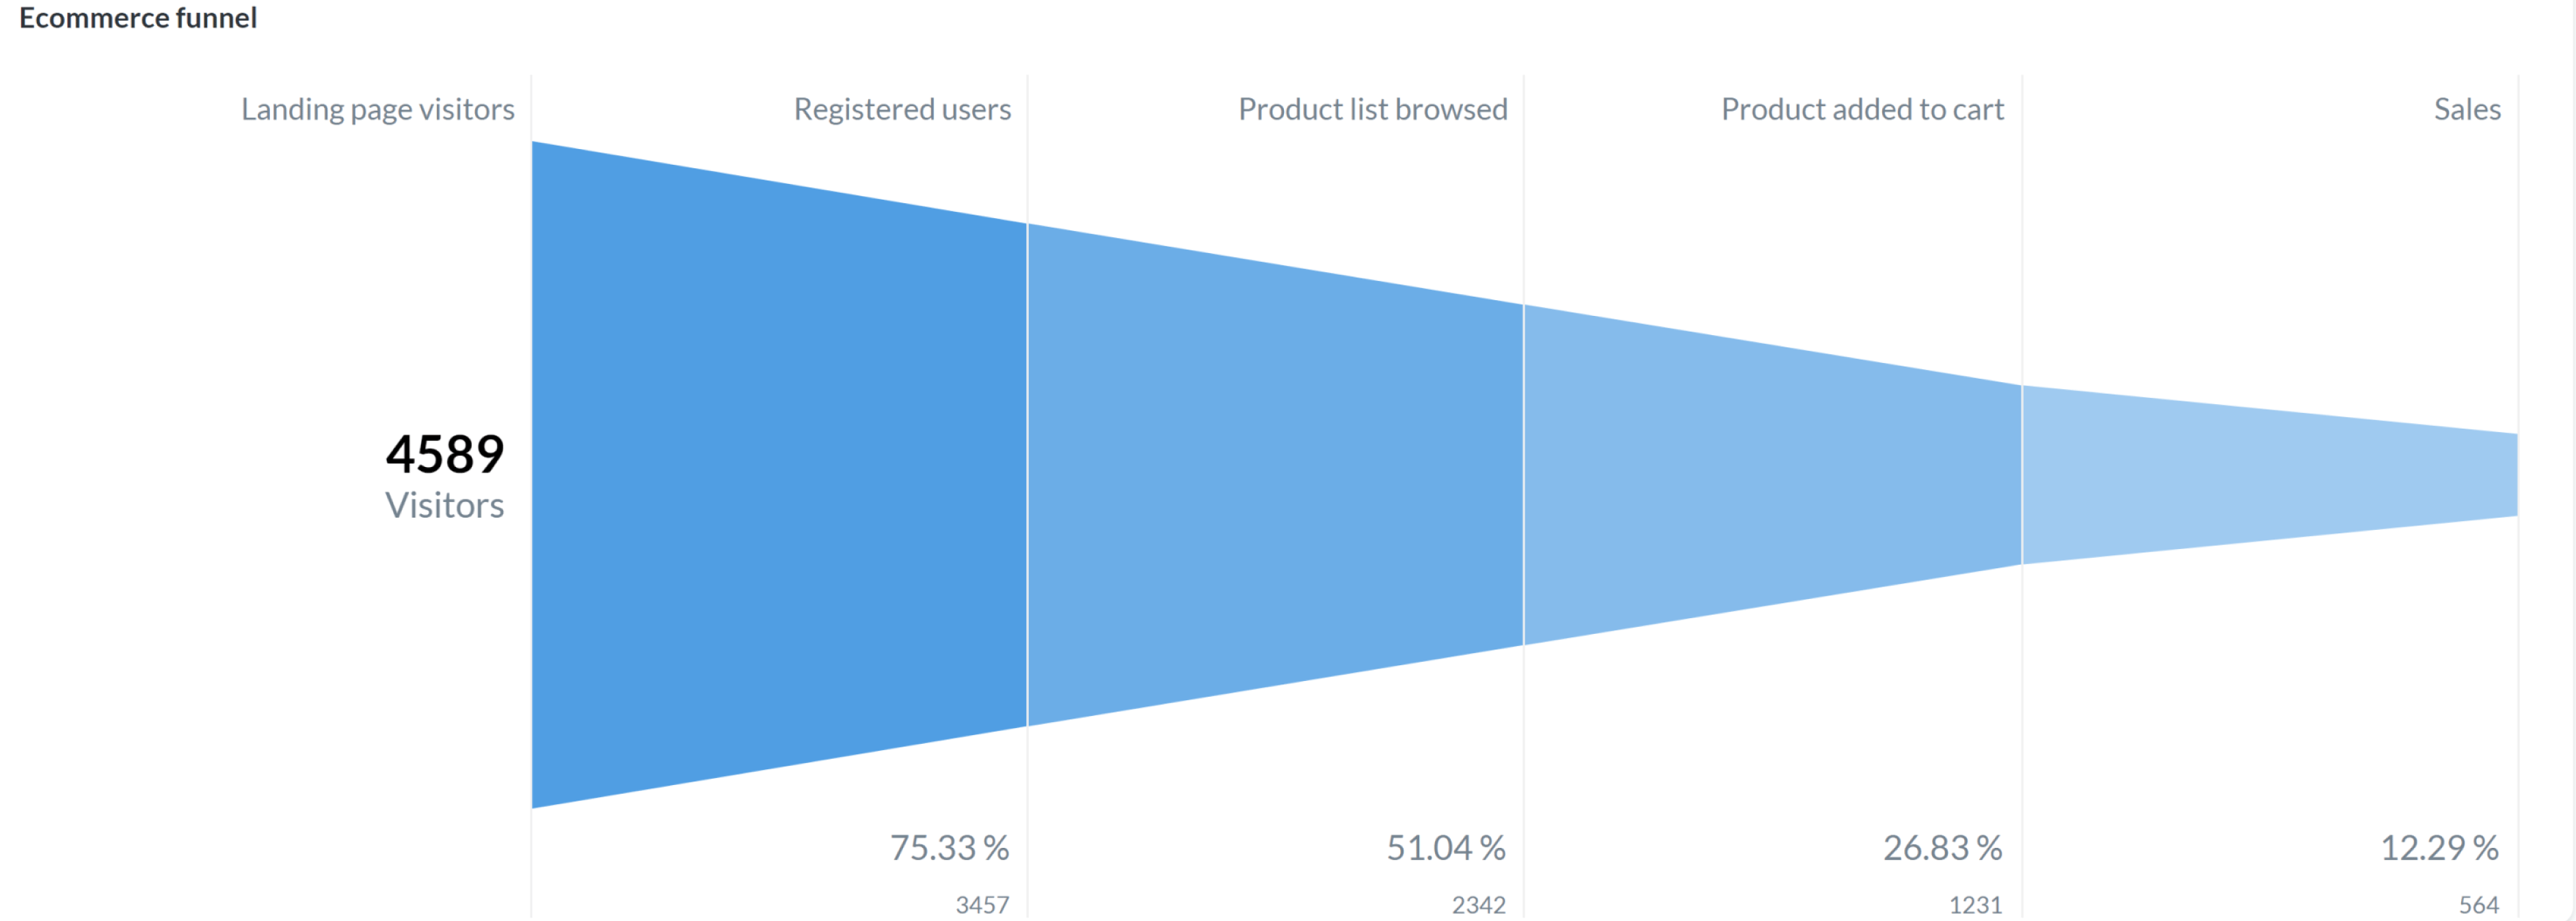
The Funnel is a marketing tool that visualizes every step a potential customer has to take to become an actual one
Cohort analysis helps with understanding the behavior or characteristics of a group of people during a certain time period

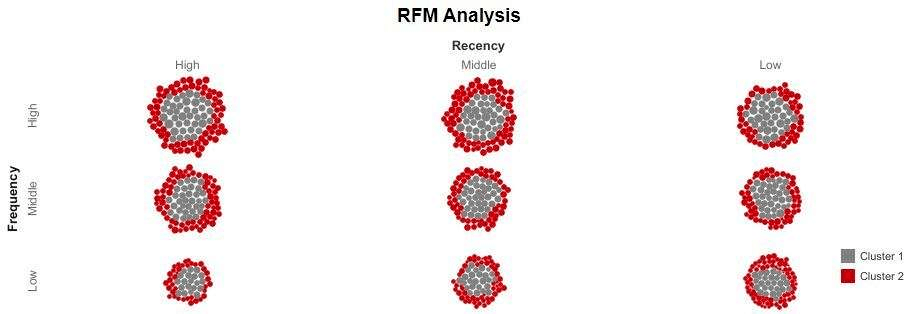
The RFM is a customer value analysis tool, based on the recency, frequency and monetary value of spending
Attribution modeling aims to credit user action (usually conversion) to a proper touchpoint
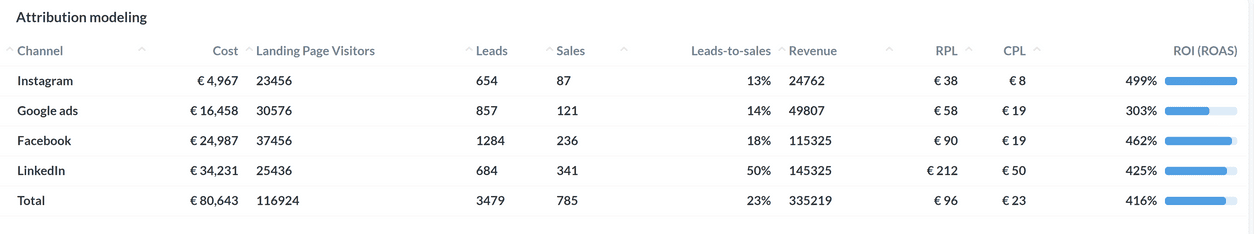
ROI % on advertising spent (ROAS) – it is important to have this metric explicitly shown, as this is the high-level performance measure of the budget spent on advertising. The metric shows the return of the funds spend on advertising
Attribution modeling – analysis of the efficiency of each channel in bringing visitors, leads, and ultimately – sales and revenue
CLV – customer lifetime value – revenue a customer would generate in their lifetime for the company; sometimes this is measured in 30, 60 and 90 days increments
RPL – revenue per lead – the amount of revenue the company generates from customers that have converted from lead to customer divided by the number of leads in the cohort; measures the efficiency of converting leas into customers
CPL – cost per lead – the amount of money spent on acquiring each lead; for most companies, this should be below RPL
Leads – to – sales – a ratio, showing what percentage of leads becomes customers
CPC – cost per click – the expense for a single click on an ad
CPI – cost per impression – the cost of a single impression
CPM – cost per thousand impressions – one of the most typical ad metrics; shows the cost of having a thousand impressions

Connect to 100+ data sources
such as Facebook, Instagram,
Stripe, Google and many more.

Load the data into your own
Data Warehouse. Run it yourself
or have SageData run it for you.

Easily visualise your data.
Integration-to-Chart time
under 10 minutes!
“Every day that goes by when you do not have accurate data to make decisions, is the day when you use intuition to make decisions”
“Every day that goes by when you do not have accurate data to make decisions, is the day when you use intuition to make decisions”
You need a report for another department? See what else we can do:
Get our FREE ebook on the best practices in data visualization: