WANT TO LEARN HOW TO DESIGN SUCH BEAUTIFUL REPORTS
YOURSELF?
YOURSELF?
Get our FREE ebook on the best practices in data visualization:


At SageData you always own your data, we help you make sense of it

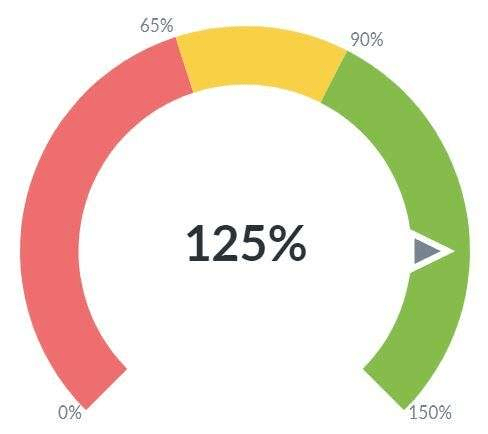
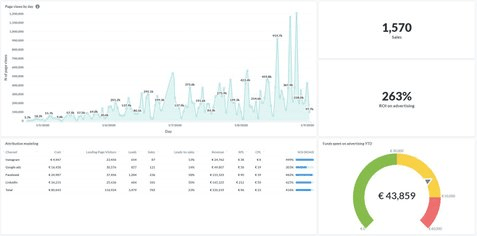
ROI % on Marketing spent – indicator for the return on the marketing efforts of the company
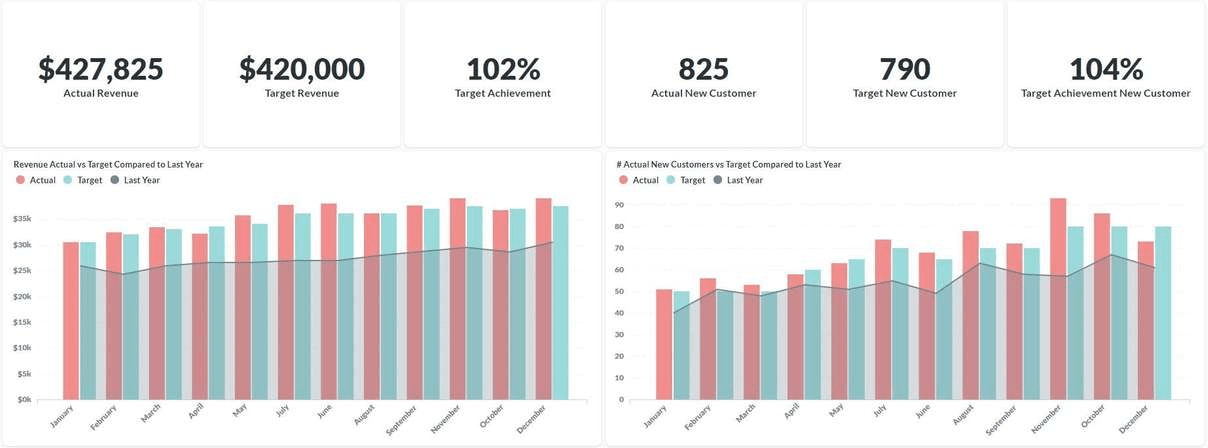
Actual vs Target revenue – the comparison between the projected amount of revenue for the month / Q / year and the actual one
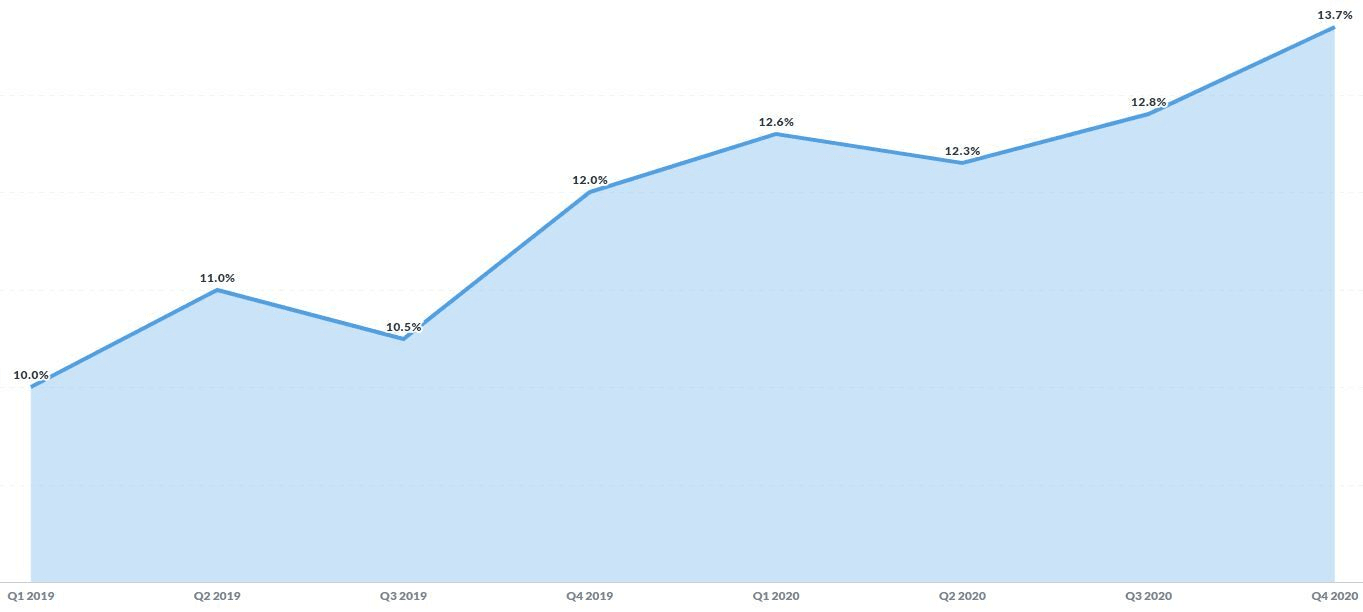
Current vs Last year revenue – shows the revenue generated for a certain time period in comparison to the last year’s period
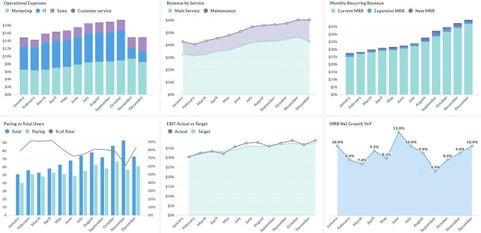
ARR and MRR – annual/monthly recurring revenue – one of the most important financial metrics for SaaS companies, showing the recurring revenue on an annual or a monthly basis
ARPU – average revenue per user – how much revenue is the company generating per user (paying and non-paying)

Connect to 100+ data sources
such as Facebook, Instagram,
Stripe, Google and many more.

Load the data into your own
Data Warehouse. Run it yourself
or have SageData run it for you.

Easily visualise your data.
Integration-to-Chart time
under 10 minutes!
“Every day that goes by when you do not have accurate data to make decisions, is the day when you use intuition to make decisions”
“Every day that goes by when you do not have accurate data to make decisions, is the day when you use intuition to make decisions”
You need a report for another department? See what else we can do:
Get our FREE ebook on the best practices in data visualization: