In this blog post, I will go over five of my favorite reports and dashboards. I will explain what important information they provide and, more importantly, what actions they enable you to take. In the end, I will tell you why those are my favorite ones.
TOP 5 reports and dashboards
1. Conversion funnel
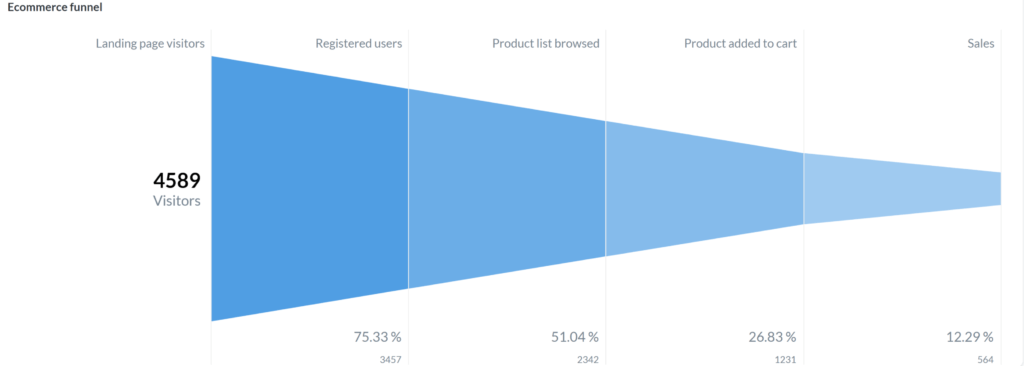
A conversion funnel is a term used to describe an e-commerce user journey, usually from seeing an ad to a conversion, most often sale. Every major action the user takes is defined as a separate funnel step. The most frequently used steps are :
Ad -> landing page -> products page -> checkout -> sale (conversion) Another example is: landing page -> registration -> cart -> sale (you can see a screenshot of this funnel below)
As common sense tells us, the number of users at each step is declining, as there are people that abandon the process (churn), for some reason. This is why the report is looking like (and called) a funnel. There are many different forms of funnels. The one I mentioned above is the most simple form of a funnel. Next, I will analyze how it can help you make decisions and take action.
What important information does this report tell you?
There is a lot of valuable information that can be found in a properly designed (and calculated) conversion funnel:
- it shows the rate of abandonment (churn) at each step of the user journey
- It shows the effectiveness of the design/visuals/UX/UI of the particular step. If we are losing a lot of potential customers at the product page, maybe the pictures are not good or the product description is suboptimal
- It shows where you should prioritize resources in order to decrease the churn. For example, if you have a large churn just before purchase, you must focus your efforts there.
What actions does this report help you take?
- You know which step is most problematic so that you can focus your effort there to decrease the churn rate. This brings the highest ROI for your involvement.
- You can implement A/B testing and iterate through different designs until you find the most effective one (with least churn)
- You understand better what customers don’t like and adjust accordingly, in order to create the most effective (read profitable) user journey.
2. Marketing ROI report and attribution modeling
In this age of fierce competition for consumers’ attention, effective marketing is one of the prerequisites for being profitable and growing as a company. This is why it’s very important for you to see how your marketing efforts and investments are paying off. In order to do that, it is not just enough to compare your ad cost for the month and the revenue you get. This is totally inefficient. In order to get a REAL ROAS, you must see in detail which specific marketing efforts and investments in ads are paying off. Additionally, attribution modeling needs to be implemented in order to evaluate correctly and attribute clients to the correct marketing source they were acquired by. This is where Marketing ROI report and attribution modeling comes into the spotlight.
First, let’s examine a typical case of an e-commerce marketing strategy. The company invests in Facebook ads, Google Adwords, and youtube ads. The marketing people have defined different campaigns and ads within these channels. Users see and click on those ads, which lead to landing pages. After that the user might go to the products page, sales page, checkout and (hopefully) to a sale (conversion).
After we have outlined the typical digital marketing user journey, let’s see what are the relevant metrics here. First, you want to see how much money you are spending on ads. This sum could be broken into channels, campaigns and ads. Next, what is the click-through rate, how many people that saw the ad actually clicked on it and got on your landing page. Next come leads and sales numbers, leads-to-sales ratio, revenue, RPL, CPL, and finally – ROAS. You ultimately would want to see how effective your ads are – what ROI do they have. The most effective way to see all the aforementioned metrics is to use attribution modeling. I won’t go into details about that topic, as we have a wonderful article, which you can check here.


What important information does this report tell you?
Basically, this report enables you to see all relevant marketing metrics and KPIs across all channels in one place.
- Ad expenditure
- CTR
- How many landing page visitors each ad/campaign/channel brought
- How many leads each ad/campaign/channel brought
- How many sales each ad/campaign/channel brought
- What revenue each ad/campaign/channel brought
- ROAS
- CPL
- RPL
What actions does this report help you take?
- Helps you make the decision of where to invest your marketing efforts (and money).
3. Mobile app usage statistics
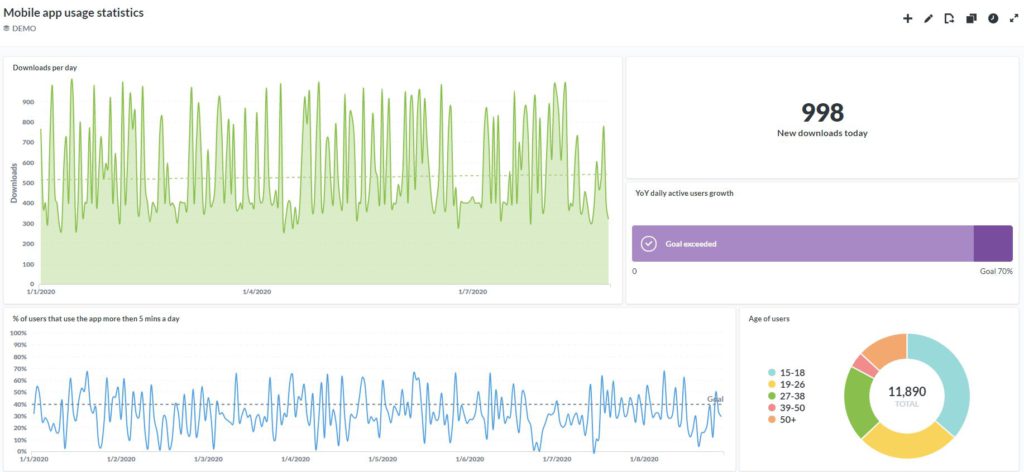
Mobile apps popularity in an age where everyone spends a significant amount of time on a mobile device every day is no surprise to anyone. To grow the user base of an app, one must understand the behavior of its current users. This valuable knowledge would let the app owner know where to focus on effort and investment.


What important information does this report tell you?
- timeline of how many downloads you have had
- % of users that use the app above x minutes a day/x times a day/week
- Age/gender of users
- Most used feature by number of users
- Active users by day
- Scatterplot that shows correlation (or lack thereof) between two (or more) factors. For example – how revenue generated by a user correlates with total minutes spent on the app, from that user and much more
What actions does this report help you take?
With the insights and information, this report gives you, you can:
- Target particular demographic more, if they are better adopting the app
- Pivot app development around the most used features
- See which factors are affecting your revenue and double-down on them
4. Sales dashboard
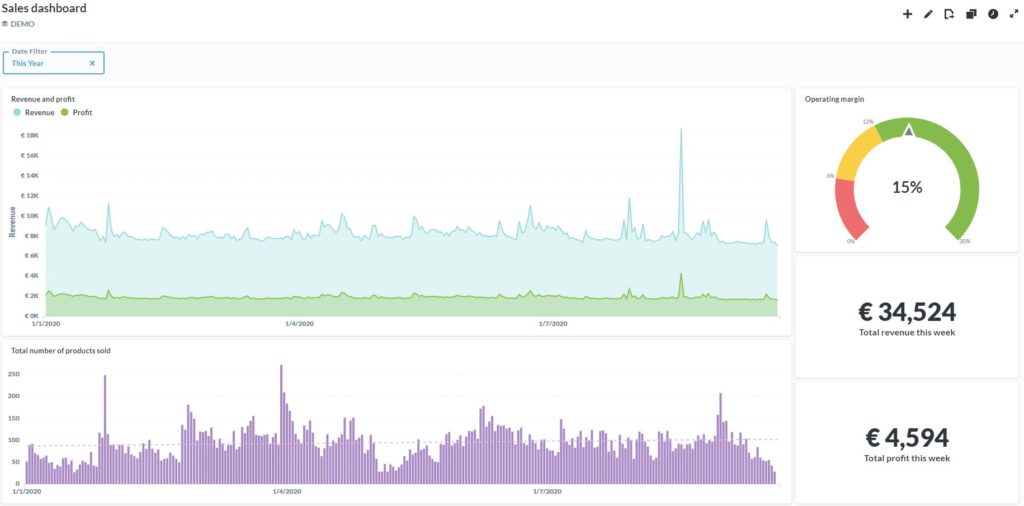
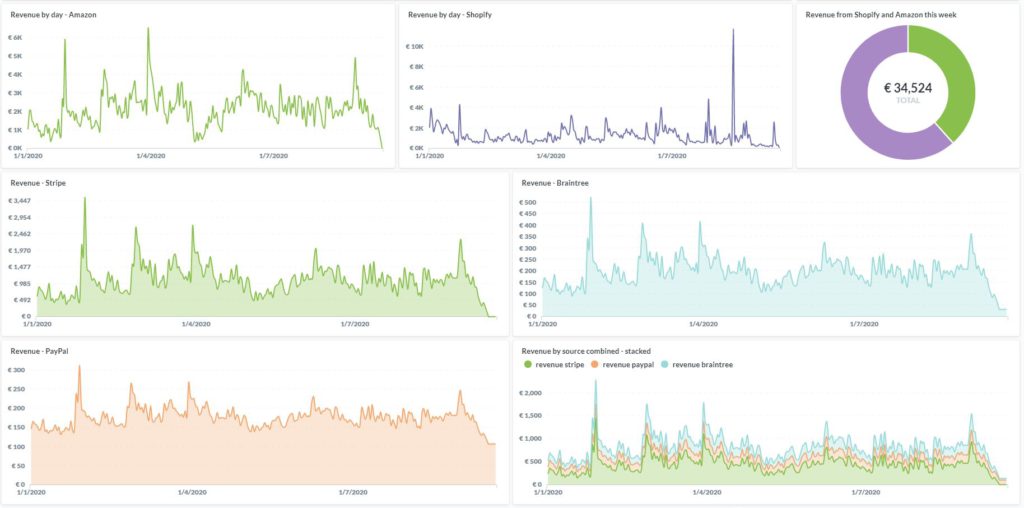
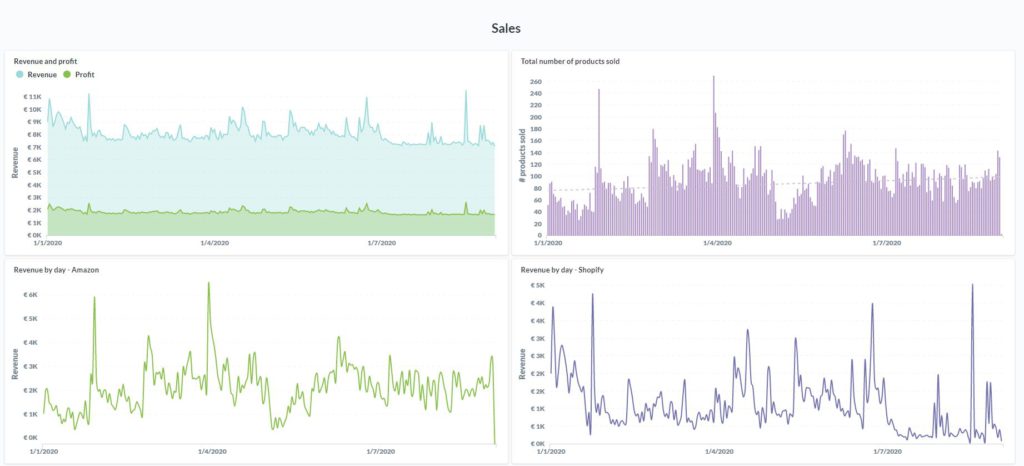
The job of an executive is to make decisions and take actions in order to make the business more profitable. In the past, this was usually directed by opinions or gut feeling. Now it is the data that drives business decisions and actions (or at least, should). Managers and executives rely on reports and dashboards to see the information they need to make those decisions. However, in the modern business world, companies usually use different systems for the different business aspects (eg. for sales, payment processing, HR, marketing, and others). This means multiple data streams, each of which results in a report/dashboard. Should a manager spend their time browsing between different tabs in order to make sense of their company’s data? No. For optimal decision-making, it’s important to have all your data at a glance. That’s why one of my favorite dashboards is the sales dashboard. There you can see not only the total revenue, profit, and profit margin for your business but also revenue (or profit) by the payment provider (eg. Stripe, PayPal, BrainTree), revenue by store (eg. Amazon, Shopify), how many clients you had, how many were first-, second- or third-time buyers, units sold and all other KPIs for your business. That way, you focus your energy on your job – to make the best decisions.




What important information does this report tell you?
- What are your profit and revenue
- What is your profit margin (is it good or bad)
- How many units you have sold
- How much revenue (profit) you get from different payment processors (Stripe, PayPal)
- How much revenue (profit) you get from different shops (eg. Amazon, Shopify)
- How many customers you had
- How many first-, second- or third-time buyers you had
What actions does this report help you take?
- Cut cost or optimize the products’ pricing (if the profit margin is small)
- Invest in certain products (that are sold the most)
- Increase inventory on certain days (when you sell the most)
- Shift towards the store you sell the most (eg. Amazon)
- Introduce a loyalty program or make your product better (to keep customers coming back)
5. Executive KPIs dashboard
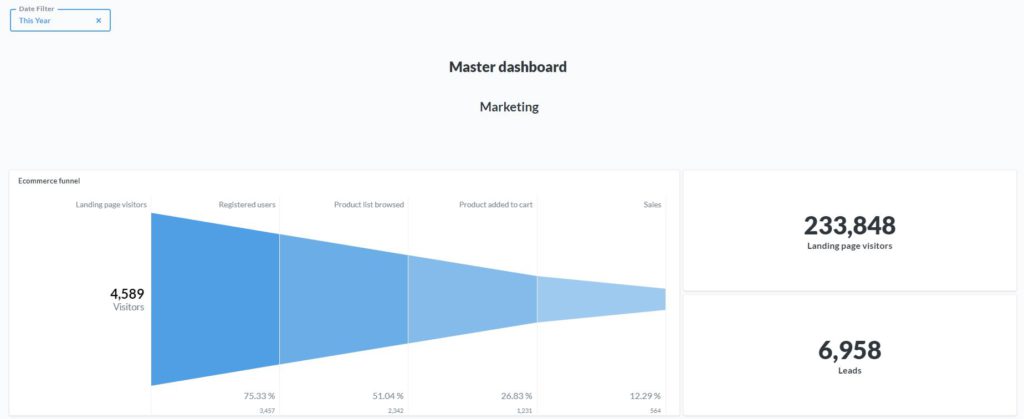
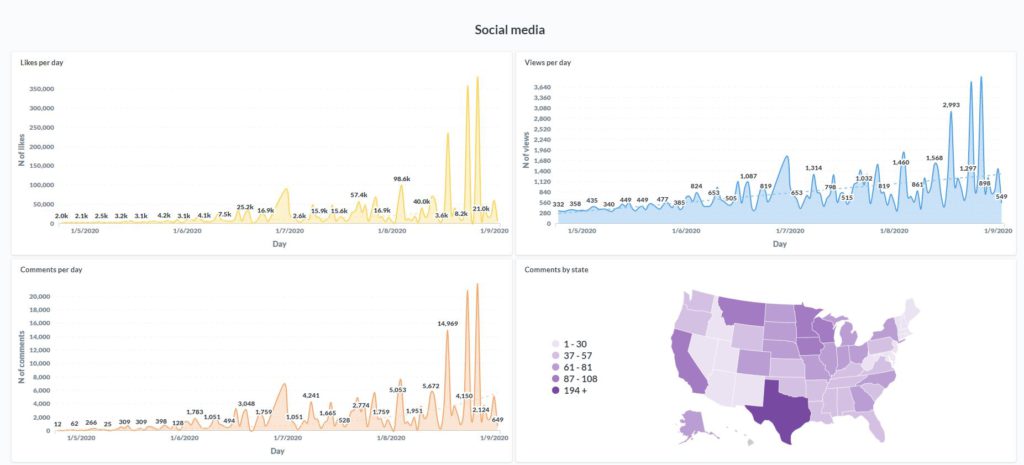
Time is our most precious asset. This is especially true for managers and executives, who need to use it for thinking, reflecting and taking the most optimal decisions for the business. In order to do that, they need to have all the relevant information, in a timely manner. Without information, taking decisions is like walking blindfolded. In my opinion, there are two very important aspects of data presentation. First one is that Information should be presented in an easily digestible and comprehensible way. The second one is that there should be enough information from all the different aspects of the business – marketing, finance, sales, hr, etc. That way the executive would have a general overview of the whole business as the different aspects are always interconnected and influence one another. I like designing different dashboards for the different aspects – marketing, website analytics, sales, etc and then combining the most important charts in a master dashboard, where the executive would have a general overview of the whole business. Here is how I imagine such a dashboard (this is the first half of it):






Conclusion
These are (part of) my top 5 favorite reports and dashboards. It’s not that I like them because of the style, design, or the charts; I like them because of the insight that they provide to the decision-makers to do their job the best way possible. In this era, everyone must make their decisions based on information derived from their data. Otherwise, it’s just another opinion. This is not optimal for your business. So, utilize your data and start making smarter (and better) decisions for your company now.
