Data Visualization Software
Data Visualisation Software for Startups

Benefits of having а Data Visualisation Software for your Business
Data visualisation tools have been gaining more and more popularity among different small and big companies all over the world. They are considered a captivating yet absolutely reliable and insightful way of identifying data trends. Presenting all the available data in a visualised and easy-to-understand manner, gives businesses the opportunity to take advantage of the information and not miss on any important points.
But why exactly do you need a Data Visualisation Software? Psychologically speaking, people tend to understand information better when it is organized visually, rather than just put in a text file or placed in a table. The eye-catching and colorful designs make identifying the relationships and patterns within digital assets quite an effortless task.
Below you can see some key advantages of Data Visualisation Software that will help you and your team members to:
- Improve readability and comprehension of large datasets;
- Quickly identify possible inaccuracies or errors in data;
- Discover latest trends through your Data Visualisation tool;
- Accelerate the decision-making process;
- Achieve your business goals with finesse and greater results;
Why a Complete Business Intelligence Solutions is Best
SageData has been providing business intelligence services to small businesses and big companies for over 20 years. Being on the market for so long has taught us the ins and outs of the business intelligence world, making us a trustworthy and professional company that will help you with the specific needs of your business. With over 100 data integrations, SageData is here to help every business no matter its niche. For maximum results, our data warehouse will be specifically tailored to the needs of your business.
Our team of professionals includes Data Engineers, Data Warehouse Architects, Product Analysts and Marketing Analysts with many years of experience in different competitive fields. They are ready to share their knowledge and expertise with you as they want to help build Business Intelligence that is as unique as your business.
Why do you need SageData? Our Business Intelligence platform gives you all the tools to holistically understand your business through all the collected data. Using SageData, you get some key benefits like:
- Automations – No more wasting time doing mundane tasks. Let us do the work for you.
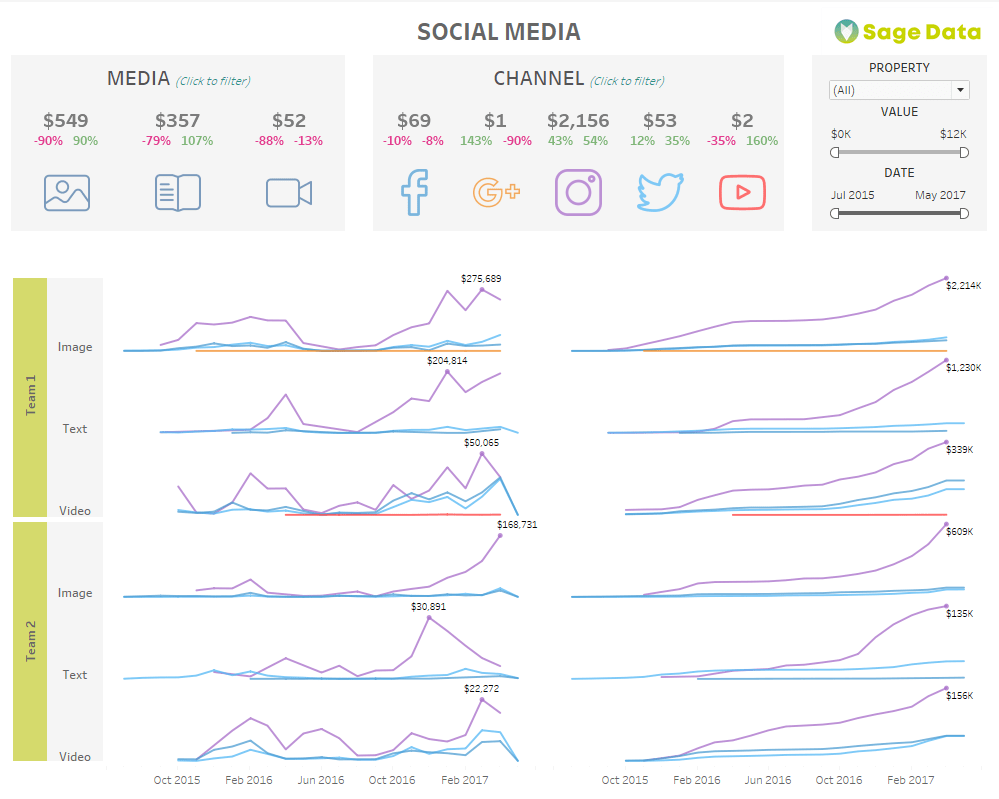
- Social Media Engagement – Check how visitors connect with your content on all your social media channels.
- Conversion funnel – Now this one is really important as it gives you insight on where exactly your visitors drop off. Conversion funnels will give you the chance to fix your mistakes and improve your conversions.
- Customer segmentation – Create a custom model to segment users.
- Marketing attribution – Connect your CPC cost with Conversions.
How BI Software works
There are three key elements that are needed for a successful and well functioning Business Intelligence system:
- Data Collection;
- Data Manipulation;
- Data Visualisation.
With SageData you get them all at once. How do they work?

Data Collection
Integrations are a key part of the data collection process. They connect all existing data into your centralised Data Warehouse.

Data Manipulation
All analyses take place in the Data Warehouse. You can rely on our fully managed one, or you can add your own.

Data Visualization
Our Data Visualisation software is an easy-to-use powerful platform that helps you organize, visualize, discover and share all the data with whoever you want.
Frequently Asked Questions
Data Visualisation is a unique way of presenting data that makes it easier for people to understand and analyze statistics and other important information related to their business. It helps you tell a story in a compelling manner that makes communication among team members easier as all the information can be effortlessly comprehended by all people.
Nowadays, thanks to the rapid advancement in technology, your data can always look splendid. SageData is here to offer you a powerful platform that would give you the best tools to make aesthetically pleasing and trustworthy graphs, histograms, pie-charts or any other charts really. There’s a variety of formats you can choose from, so you can decide what best represents your data and corresponds with your business’ brand identity.
Yes! Our Data Visualisation software gives design ideas and solutions that are applicable to each and every business. Every business can benefit from having its data neatly organized.
You can choose from a variety of reports so that you get the best experience. Some examples are:
General business KPIs and Metrics report;
- Conversion Funnel Reports;
- Attribution Modelling Reports;
- Social Media Analysis Reports.
Considering that nowadays consumer behaviour is being collected on a daily basis, we can say that reports made with a Data Visualisation Software can help you quickly keep up to the dynamically changing conditions in the business world. Why so? In order to keep track, you would have to update your data more often than you think. The more information one has, the more difficult it would be for them to understand. Visualised reports deal with that problem as they give all the information in an organized and easy to comprehend way.
