SageData and Bikmo a Case Study
Automated data reports and data processing for fully engaged business strategy.
Talks to us to become data-driven:
Play Video


Industry: Cycling Insurance/ InsurTech
Bikmo is a market-leading cycle insurer, which mission to protect the world’s riders, and the places we ride. They are growing extremely fast, and now protect over 75,000 riders across the UK, Ireland, Germany and Austria, and they count the likes of British Cycling, Deliveroo, Brompton and Cyclescheme as partners.
They build awesome insurance products to protect customers for unexpected events, use technology to make taking out and managing your policy ultra-simple, and provide exceptional customer experiences through their team of bike geeks. Working with leading brands, athletes and partners, they want to inspire people to live better by riding more and being active in the epic outdoors.
TechStack:


When the company reached out to SageData, they were working with disparate data sets across multiple platforms and it was difficult to have a unified view of the business. The team was wasting time combining different databases and data sources in order to have a complete view of the business.
All those challenges led to problems in data management, such as incorrect data or inaccurate data, especially when the data was provided manually. Furthermore, due to the numerous data sources, Bikmo was underutilizing their data and was not able to create an understandable picture of their business.
First and main task for SageData was to align clarify and align all important metrics and KPIs, which were crucial to understanding and driving Bikmo’s business and their position in the market environment.
SageData deployed an intelligent BI platform for Bikmo by rolling out the best tools for data management, part of SageData’s platform.
Furthermore, we have created unified monthly and weekly reports, which were updated and refreshed multiple times a day. This allowed each team to create a clear view of their business and their goals. Each department received distinctive dashboards, focusing on their unique activities and needs.
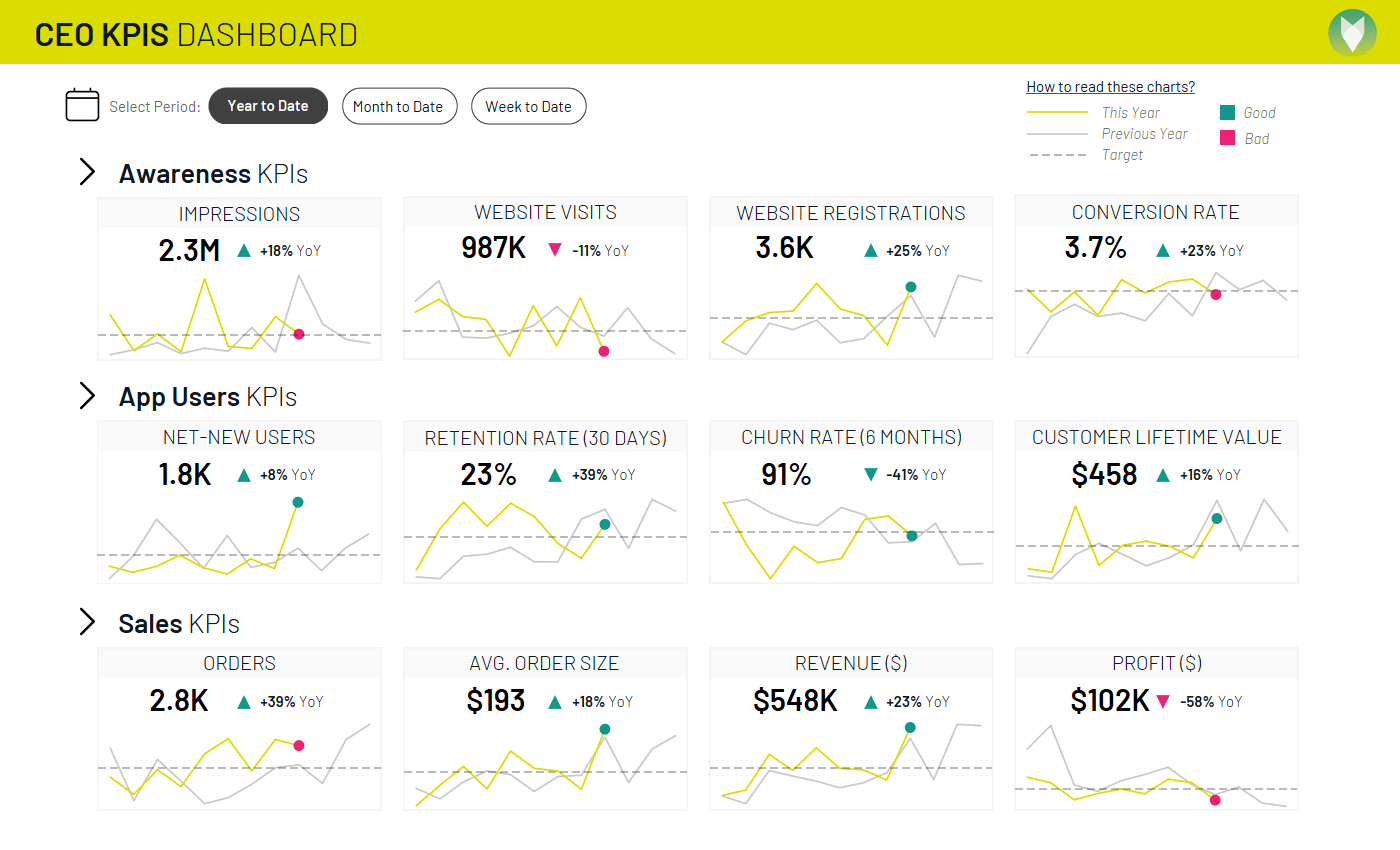
KPIs and Metrics, North Star, Trends, Budgets and Forecasting, we do it all. SageData team helps you collect data, transform it and create insightful reports.
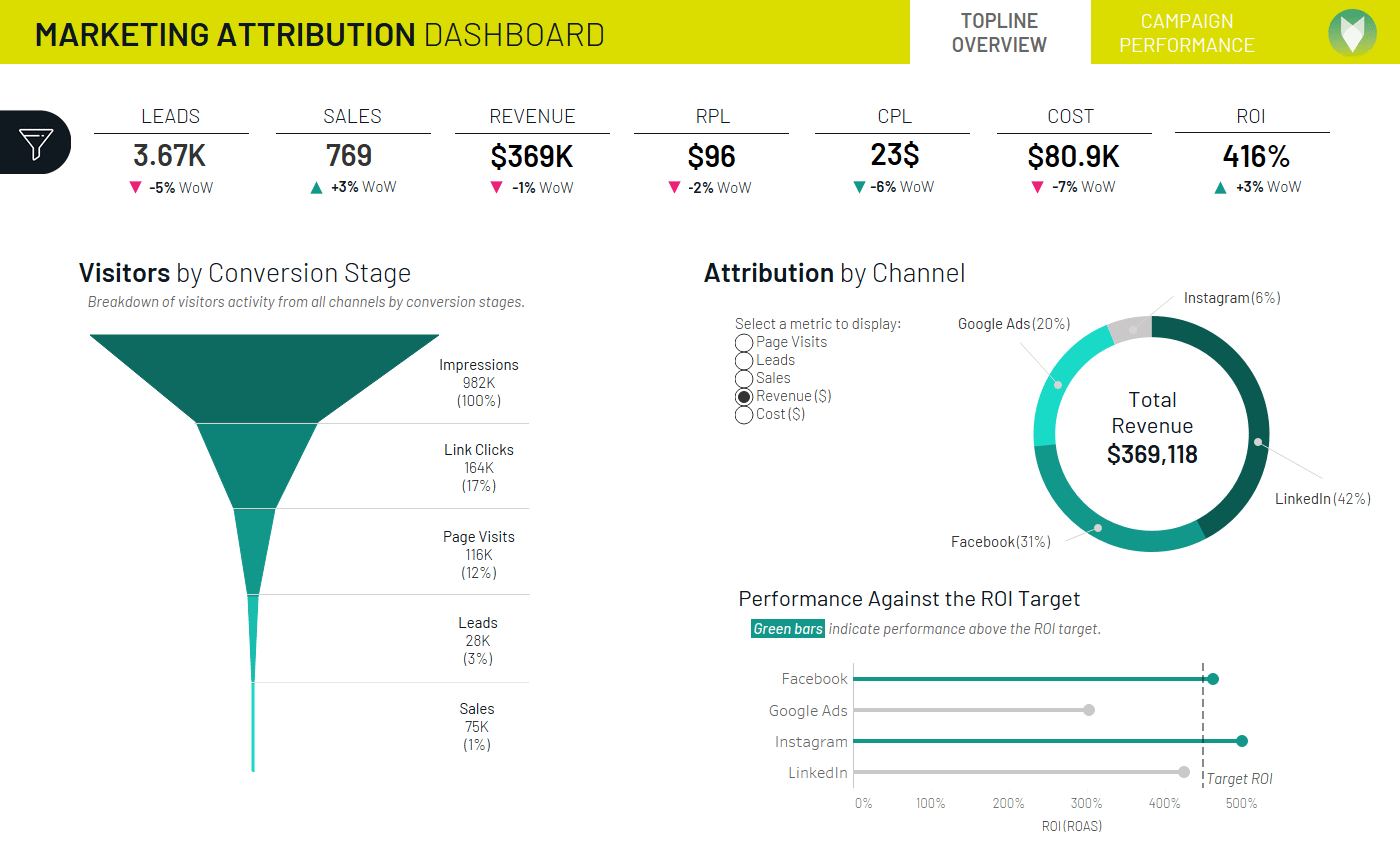
Marketing Attribution and Customer Journey Analytics. SageData team helps you collect data, transform it and create insightful reports.
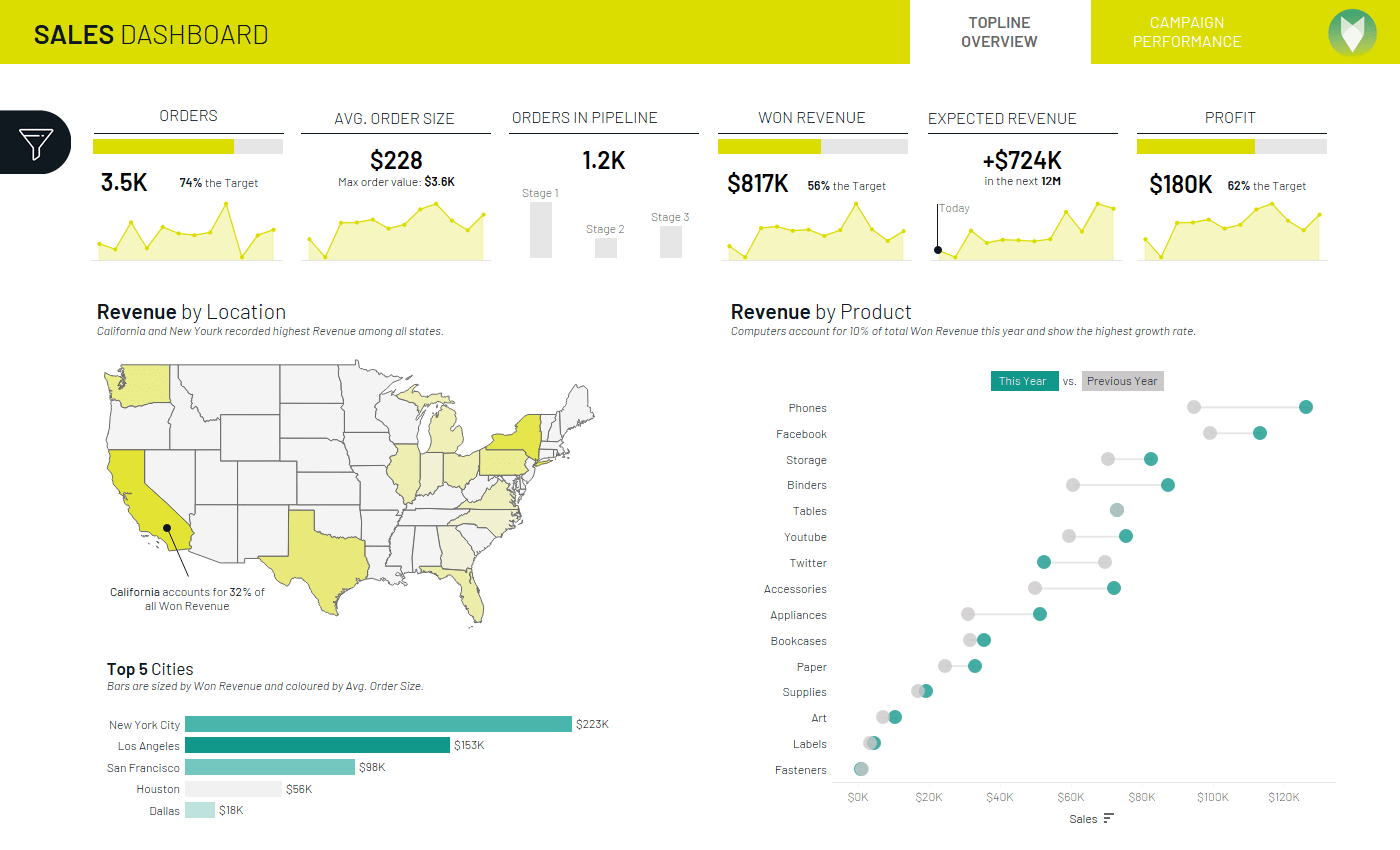
Sales reports can group the revenue by geography, product, customer segment. Great for companies who started to expand into new markets
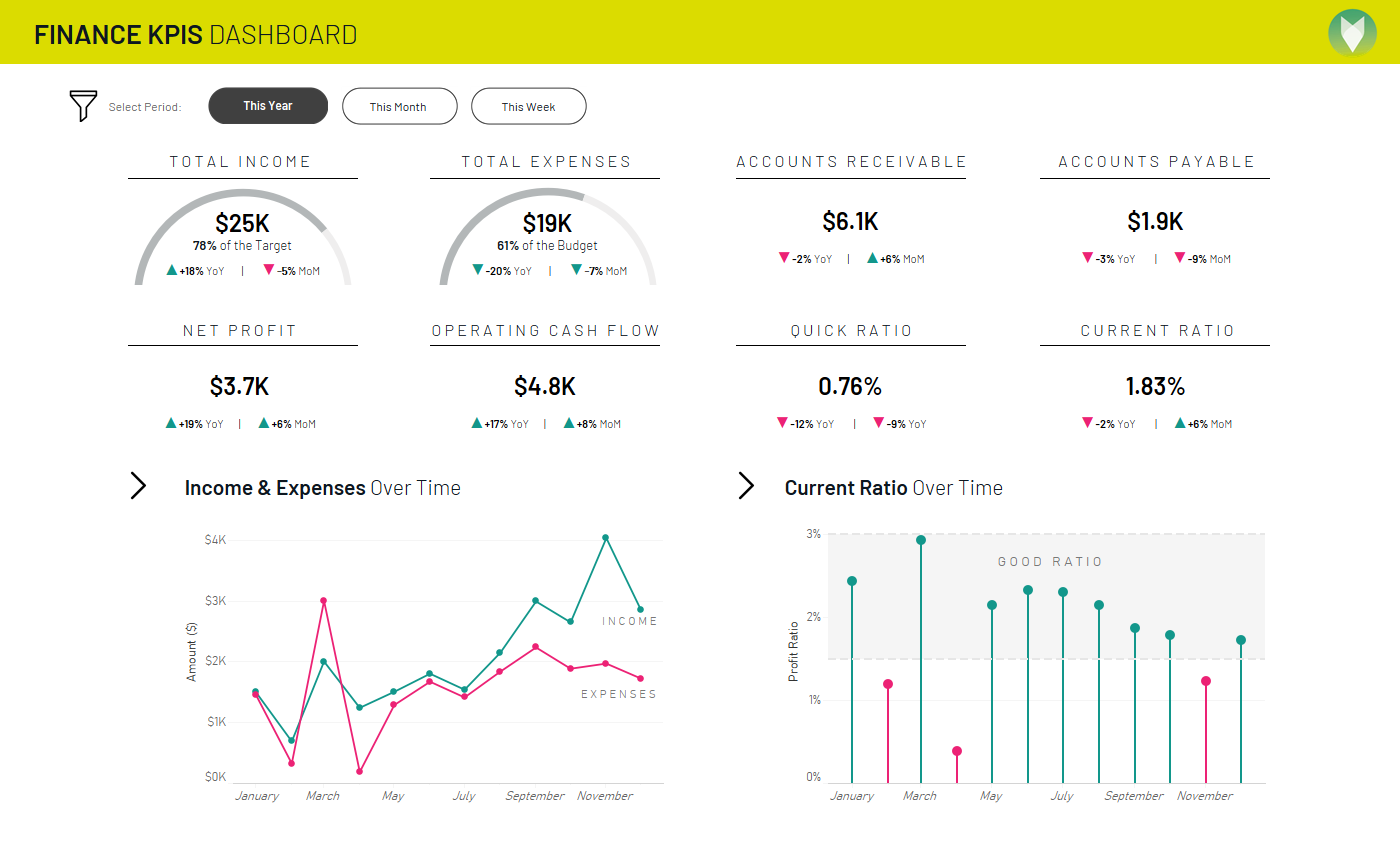
Finance metrics show overall health of the company and compare trends to the budgets and forecasts.
After implementing all the necessary steps for secure and intelligent data management, Bikmo’s team was able to process claims much faster using automated reports. The payment department extremely reduced the time of processing and following up on each case. All this led not only to an improved and more satisfying customer experience, but also increased the company’s revenues. The data enabled more ad hoc analysis that reveals new market opportunities.
Furthermore, management had a more clear view of how the company was acting vs. their target budget. All teams were able to react sooner and faster when they saw indicators for underperformance. We were able to save hundreds and hundreds of management hours, spent on analyzing different complicated and sometimes inaccurate dashboards, just by automating reports and data processing
Finally, Bikmo was able to achieve high data accuracy and finally trust their data, not questioning their numbers, but strongly focusing on their business.
Better to be put in their own words:
This is the fastest we have ever gone from 0 to insights. – Gary Bright, COO.
At SageData you always own your data, we help you make sense of it
We spend time with you and your stakeholders in order to understand what is important to you and how you look at your business. We ensure that everyone speaks the same data-language by consolidating KPIs, their definition and formulas.
We deconstruct your KPIs into the relevant data components and link them back to the data sources.
We establisht he data granularity so you always have the lowest level of drill down available to your teams.
Our engineers work with your Data Teams to establish the best data engineering practices and create an architecture that will be easy to maintain and scale.
The Data Analysts in SageData team will set up data modeling processes that will efficiently transform and aggregate your data.
Our team will seet up the tests and checks to validate the data before your reports are updated so you have complete trust that your analytics are always accurate.
We train your teams on the best data practices and methodologies to ensure that our collective knowledge is used to support your business in the future.
Our goal is to ensure that your teams are well equipped to analyse the data and get the needed insights will into the future.
Connect to 100+ data sources such as Facebook, Instagram, Stripe, Google and many more.
Load the data into your own Data Warehouse and apply your KPIs and Metrics.
Easily visualise your data. Integration-to-Chart time under 10 minutes!