WANT TO LEARN HOW TO DESIGN SUCH BEAUTIFUL REPORTS
YOURSELF?
YOURSELF?
Get our FREE ebook on the best practices in data visualization:

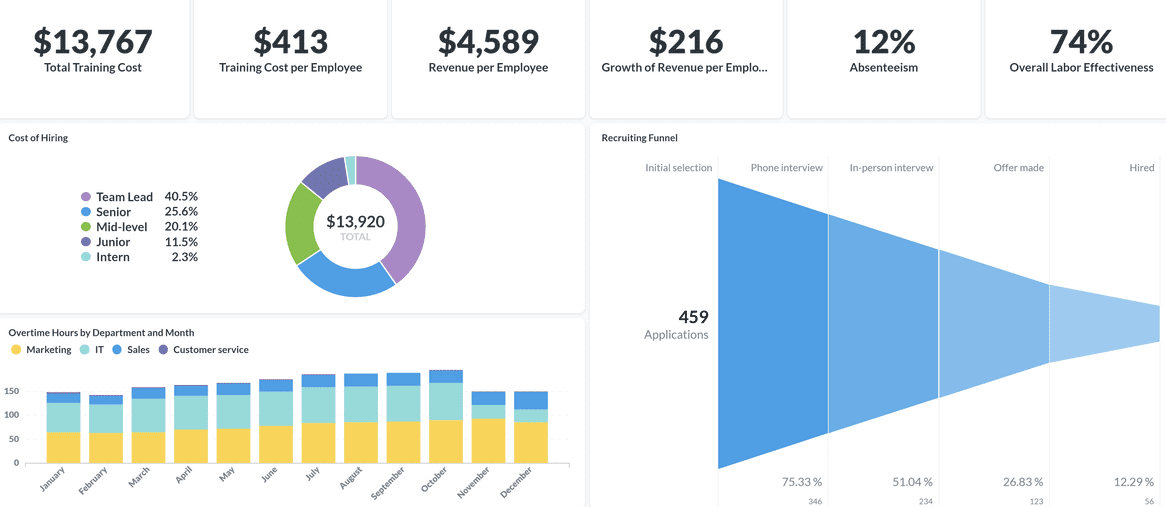
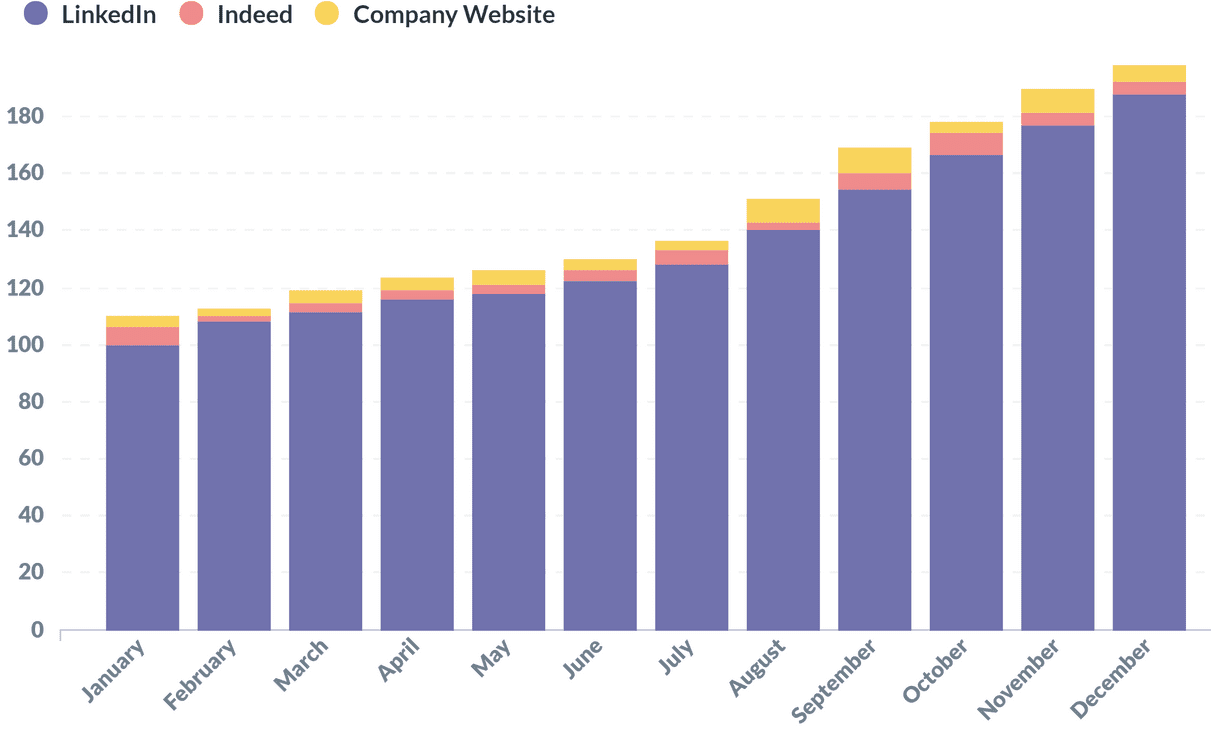
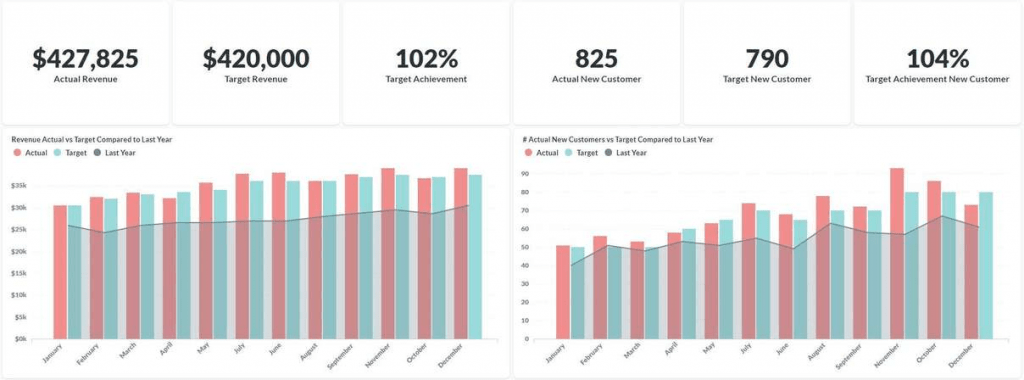
People are an important part of every thriving business. Retaining and motivating the human talent is as much an art as it is a science. Whether you want to improve your employee retention or understand workforce satisfaction survey results, SageData can give you the right integrations and tools to bring all of your data together and visualise it, so you can have a clear picture. Our HR Report displays some of the most popular metrics used by people teams. Overall Labor Effectiveness and Absenteeism reveal what is the average productivity among the workforce and how many unexcused absences there were in relation to the total working days. Revenue per employee shows, on average, how much each employee contributes to the company, in financial terms. The Recruiting Funnel is a great way to easily understand the selection process of the company and see what stages are most effective for talent evaluation. This could be used to fine-tune the recruitment process which then leads to lowering the cost of hiring (in terms of time and money spent).
At SageData you always own your data, we help you make sense of it


Total Training Cost – the total amount of funds spent on employee training
Training Cost per Employee – the total training cost divided by the number of employees that went on a training
Growth of Revenue per Employee – the amount of revenue the average employee contributes to the revenue growth
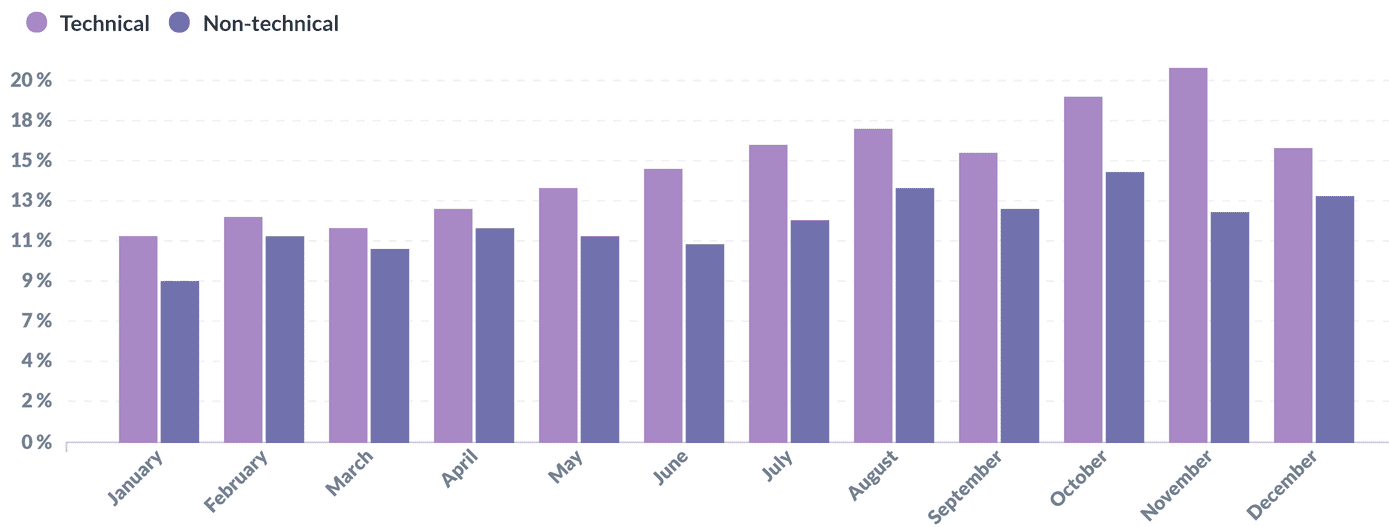
Cost of Hiring – shows the cost of acquiring talent by the level of expertise
Overtime Hours by Department and Month – the number of hours worked extra by department and month

Connect to 100+ data sources
such as Facebook, Instagram,
Stripe, Google and many more.

Load the data into your own
Data Warehouse. Run it yourself
or have SageData run it for you.
Easily visualise your data.
Integration-to-Chart time
under 10 minutes!
“Every day that goes by when you do not have accurate data to make decisions, is the day when you use intuition to make decisions”
“Every day that goes by when you do not have accurate data to make decisions, is the day when you use intuition to make decisions”
You need a report for another department? See what else we can do:
Get our FREE ebook on the best practices in data visualization: