Chiliz Case Study
Modern data management for data-driven business decisions.
Talks to us to become data-driven:

Industry: Blockchain/Sports and Entertainment
Chiliz (CHZ) is a currency option for blockchain-backed products & services geared towards mainstream consumers. It is a blockchain technology provider for the sport and entertainment industry. Chiliz is operating the fan token cryptocurrency platform Socios.com. Founded in Malta in 2018, the company’s goal is to provide millions of sports and esports fans a token that would allow them to buy a share of influence in their favorite sports or esports clubs.
TechStack:

At the start of our work together, Chiliz was spending a lot of time and effort on running data analytics and creating dashboard. There was no dedicated BI tool (Business Intelligence), and there was a feeling that data was still not being used to its full potential.
Chiliz was in the need of dedicated data analytics and management strategy. As a crucial step to employing effective data analysis at scale, successful data management is leading to important insights that add value to Chiliz customers and improve its bottom line.
Chiliz and SageData work together on finding the best option for data governance. SageData developed a data management strategy in order to improve time and quality efficiency, as well as gaining valuable insights from the existing data.
As first step, we at SageData decided that it is crucial to create comprehensive KPI library with consolidated references and formulas for each KPI, used as single reference point for everybody. This was it was made clear how metrics were calculated or where they were coming from. If there was a change on DB level, reports and analytics could always refer to the library.
The next step was to launch and properly engineer a dedicated DWH (data warehouse) for Chiliz, that was extremely fast in responding to user queries and ingesting data. We created data pipelines – all internal databases and data sources were connected to the DWH. We created data streaming processes for secure and effective data flow throughout the system. By setting up automation scripts we were able to clean and sanitize the data, thus insuring data accuracy.
Using a metabase instance to create initial reports, the newly created data management team at Chiliz had a solid starting point for their future analysis. Chiliz internal team continued adding further integrations, data sources and using the best practices, that were initialized by SageData’s team.
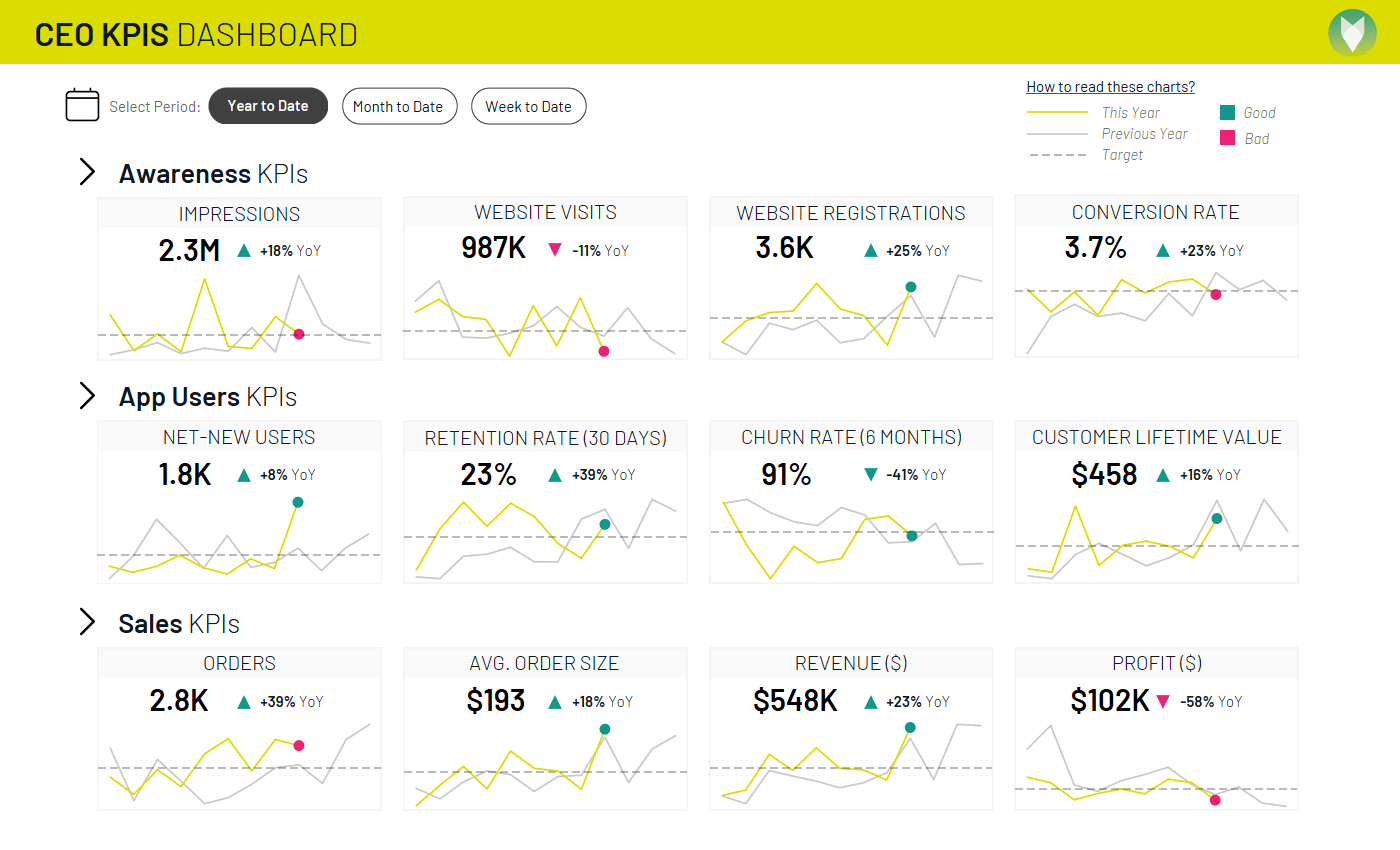
KPIs and Metrics, North Star, Trends, Budgets and Forecasting, we do it all. SageData team helps you collect data, transform it and create insightful reports.
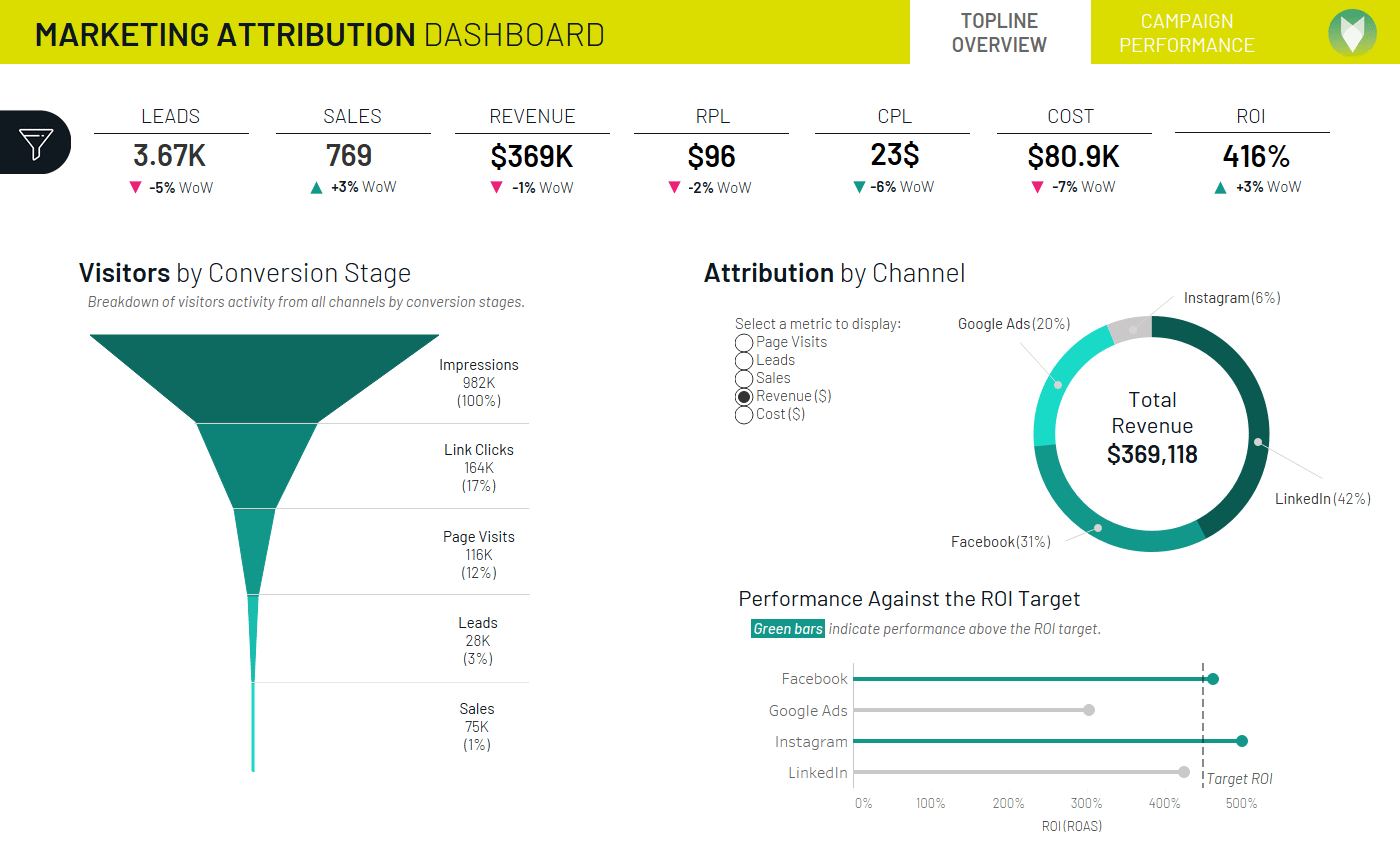
Marketing Atribution and Customer Joyrney Analytics. SageData team helps you collect data, transform it and create insightful reports.
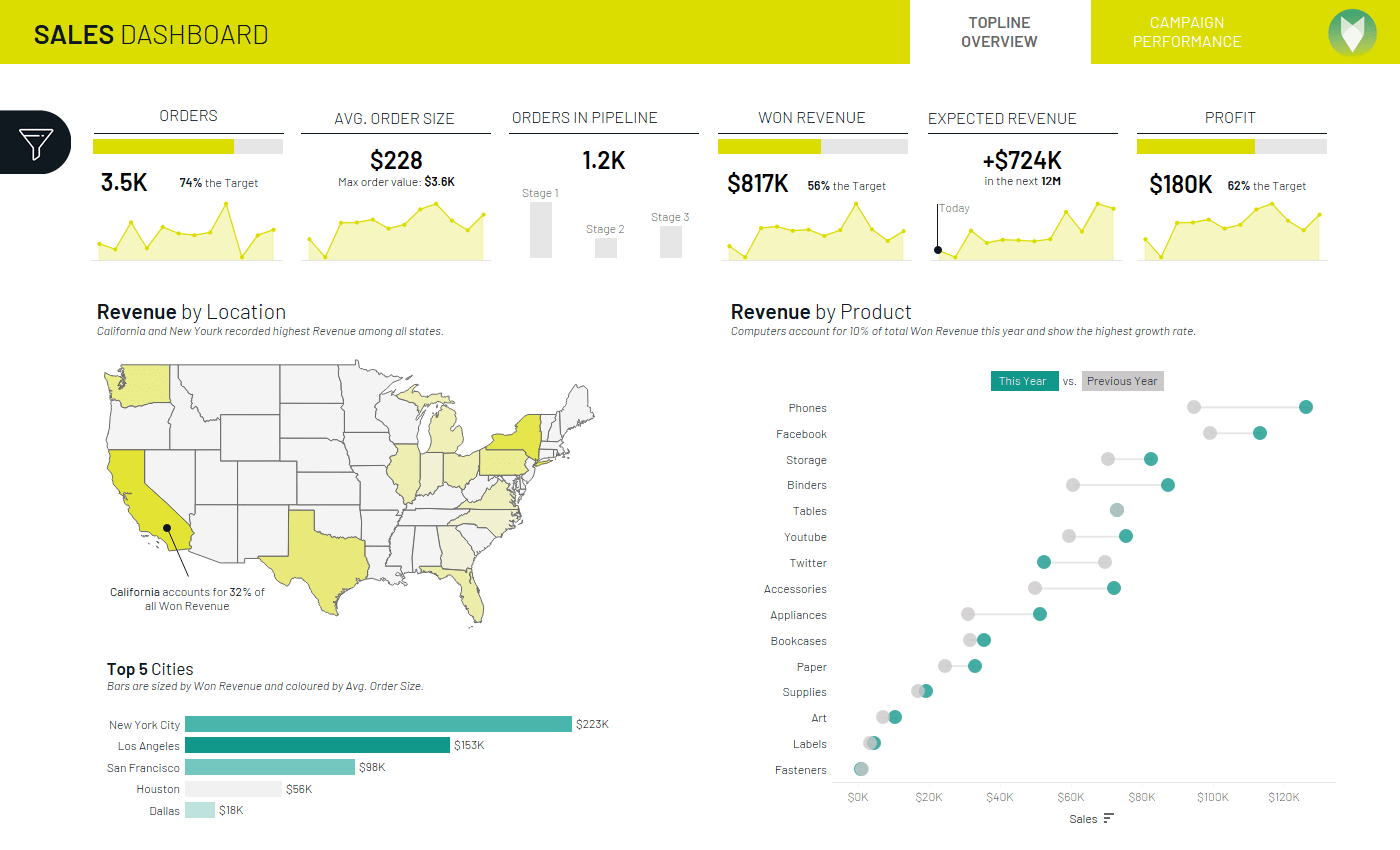
Sales reports can group the revenue by geography, product, customer segment. Great for companies who started to expand into new markets
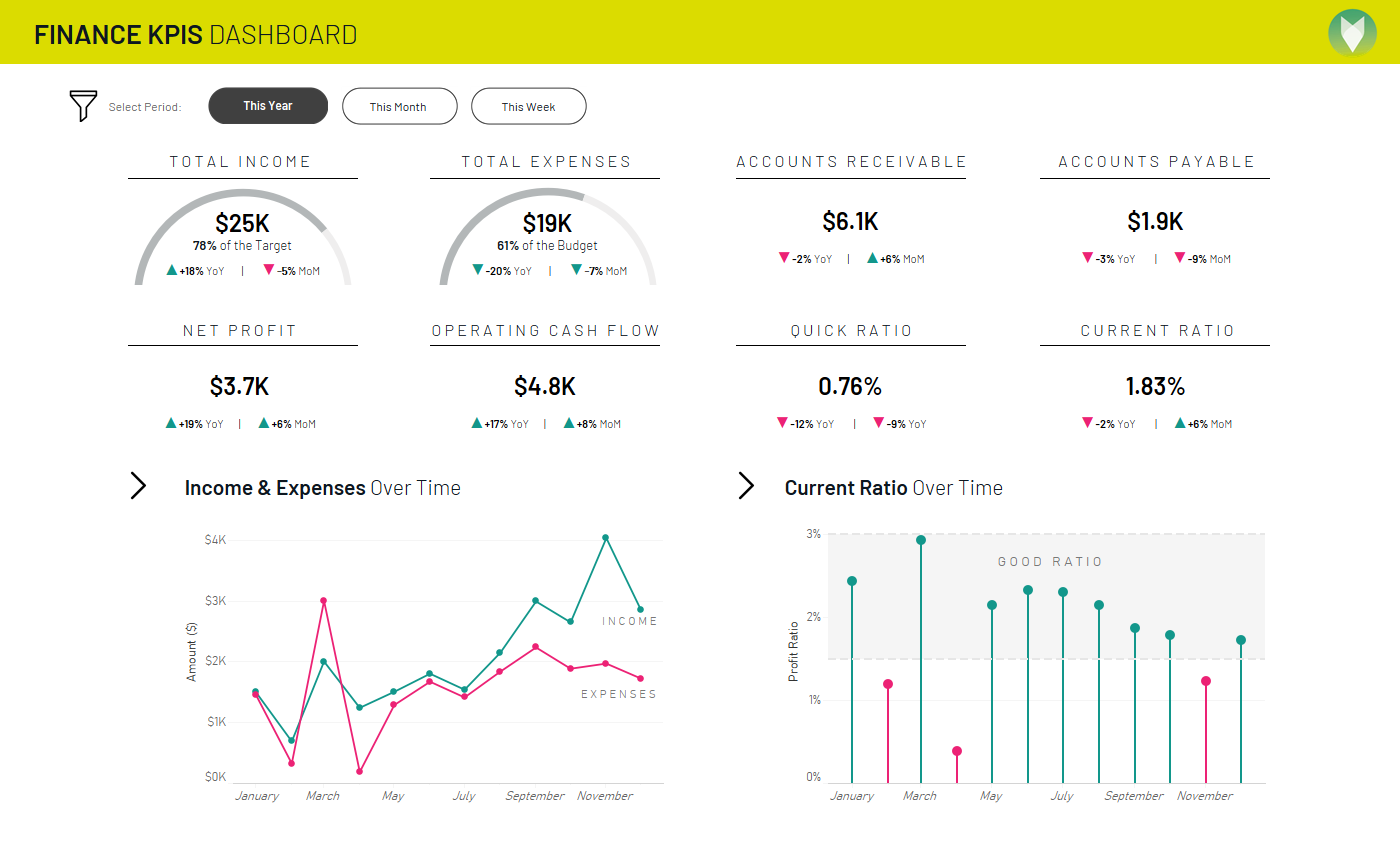
Finance metrics show overall health of the company and compare trends to the budgets and forecasts.
Chiliz has now access to valuable insights from their data, which can help them find the best business decisions and growht-strategy. Their internal data team has the opportunity to explore the data at much deeper levels. At the same time, Chiliz has freeing up time to focus on higher value projects.
The team has enough infrastructure and technology to comfortably service all their analytical need within the next years and beyond. The team is moving closer towards data streaming and live data processing to have the latest date to make smart decisions.
At SageData you always own your data, we help you make sense of it
We spend time with you and your stakeholders in order to understand what is important to you and how you look at your business. We ensure that everyone speaks the same data-language by consolidating KPIs, their definition and formulas.
We deconstruct your KPIs into the relevant data components and link them back to the data sources.
We establisht he data granularity so you always have the lowest level of drill down available to your teams.
Our engineers work with your Data Teams to establish the best data engineering practices and create an architecture that will be easy to maintain and scale.
The Data Analysts in SageData team will set up data modeling processes that will efficiently transform and aggregate your data.
Our team will seet up the tests and checks to validate the data before your reports are updated so you have complete trust that your analytics are always accurate.
We train your teams on the best data practices and methodologies to ensure that our collective knowledge is used to support your business in the future.
Our goal is to ensure that your teams are well equipped to analyse the data and get the needed insights will into the future.
Connect to 100+ data sources such as Facebook, Instagram, Stripe, Google and many more.
Load the data into your own Data Warehouse and apply your KPIs and Metrics.
Easily visualise your data. Integration-to-Chart time under 10 minutes!