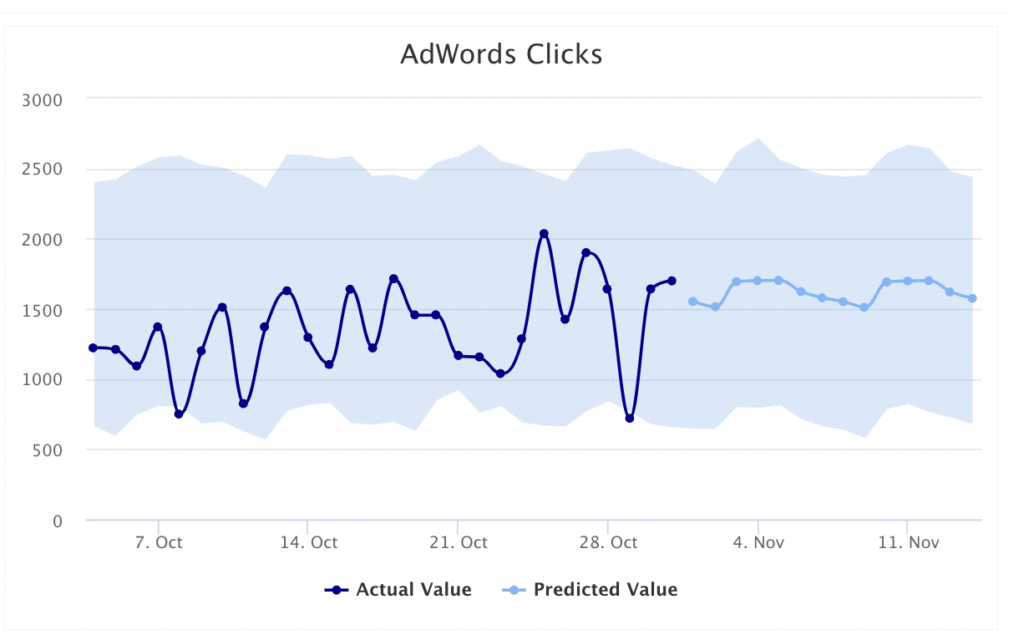
SageDatas’ forecasting is an important and valuable tool for your business. It gives you the ability to develop data-driven strategies and to make informed business decisions.
You can make financial and operational decisions based on current conditions and future predictions of the market. Historical data is aggregated and analyzed to find patterns. Those patterns can be used to predict future trends and changes. The goal of forecasting is to allow your company to be proactive instead of reactive.
You can track valuable data, such as:
- Amount of purchases
- Clicks and visits on your sites
- Sales
- Transactions
This can help you with setting goals, better budget planning, and quicker anticipation of changes in the market.
How to launch SageData forecast?
Sign in
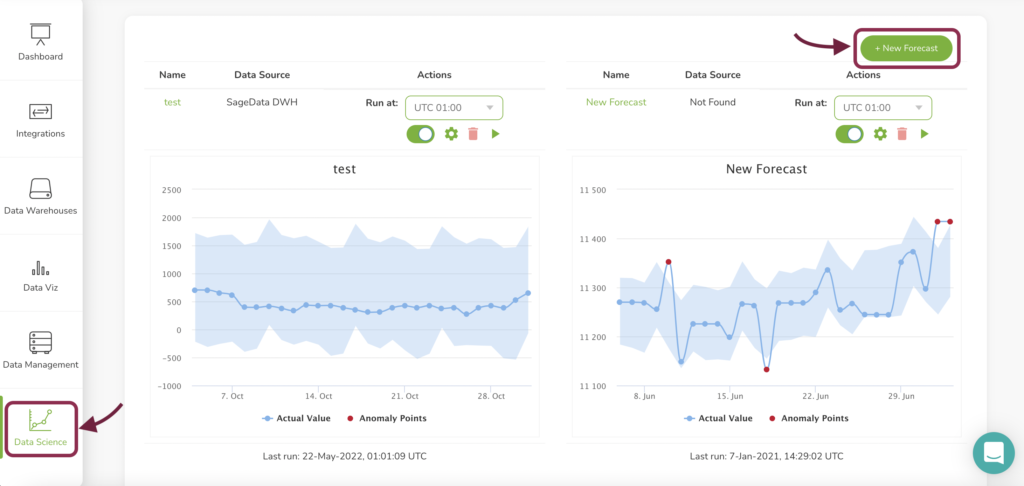
Go to SageData’s login page and log in to your account. Find the Data Science Tab on the left side and click on it.
Note: In order to create new SageData forecast, you should have your data warehouse connected to your account.
Create new forecast
STEP 1: Select metrics
Before creating the forecast, you will have to decide which business metrics you want to predict. For example, you can decide to create a data forecast for your customer registrations, in order to better plan your server capacity or manufacturing processes.
STEP 2: Select table
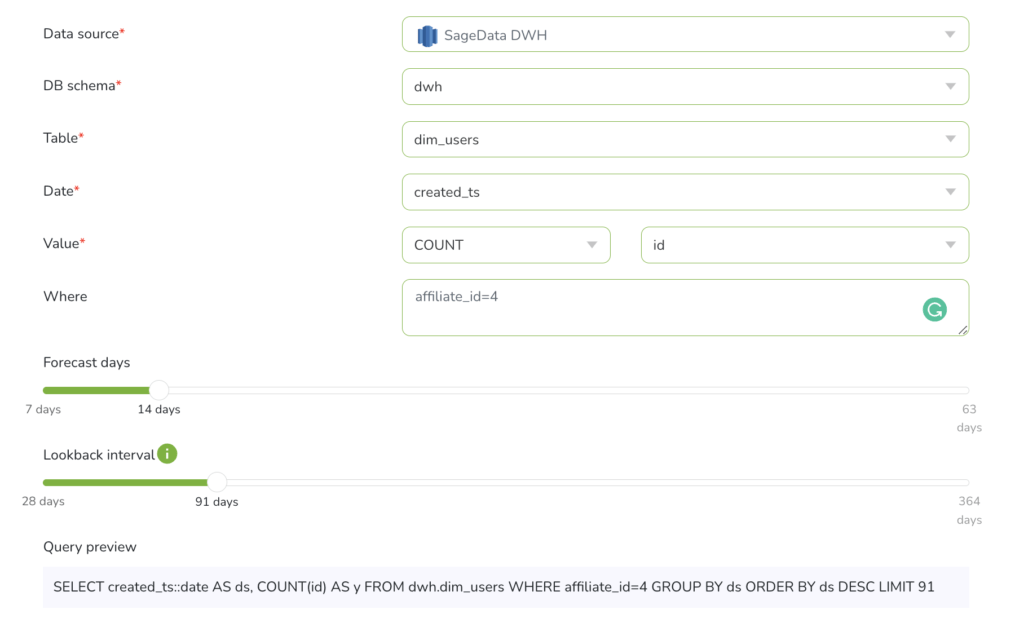
Start by selecting the data source, schema, and table. These parameters will be used as a source for your data, on which the forecast will be based.
STEP 3: Select Date column
Now select the date/ date-time column from your table. This will be used as the time span for building your forecast on your data. Usually, it is the timestamp of when the records were created, such as created_at field.
STEP 4: Select value
As next, you will have to decide which is the exact data that you would like to be forecasted.
In our example below we will create forecasting for customer registration based on the number of registrations.
STEP 5: Add filters (optional)
You can choose to filter your data and monitor only the subset of your data, such as the amount of registration coming from a particular affiliate program. You can use the Query Preview window to see the exact query SageData will run to fetch the data.
STEP 6: Select lookback and forecast interval
As forecast and anomaly detection goes hand in hand, you can select amount of days you want to have your future forecast for, as well as the lookback interval.
Example: Your table consists of data for the past 4 years. One of your most powerful ad campaigns ran in the last month. You would like to understand it and gain insides into it. Then select 30/31 days as a lookback interval. Your SageData forecasting will be built based on this interval the fo.
Note: The longer the lookback interval, the higher the possibility of adding old inaccurate data to the monitoring and forecast. Beware of the accuracy of the historical data in your table for the predictions and monitoring.
STEP 7: Run
Give a name to your forecast and click on run. Now SageData is collecting the data from the data source and counts the customer registrations for the selected interval. You will see a graph that visualizes your actual data and the predicted data.
Only after you click on save, the forecast graph will be shown on your Dashboard.
STEP 8: Manage dashboard
After SageData has created and saved your forecast, it will be shown on the dashboard of the Data Science section.
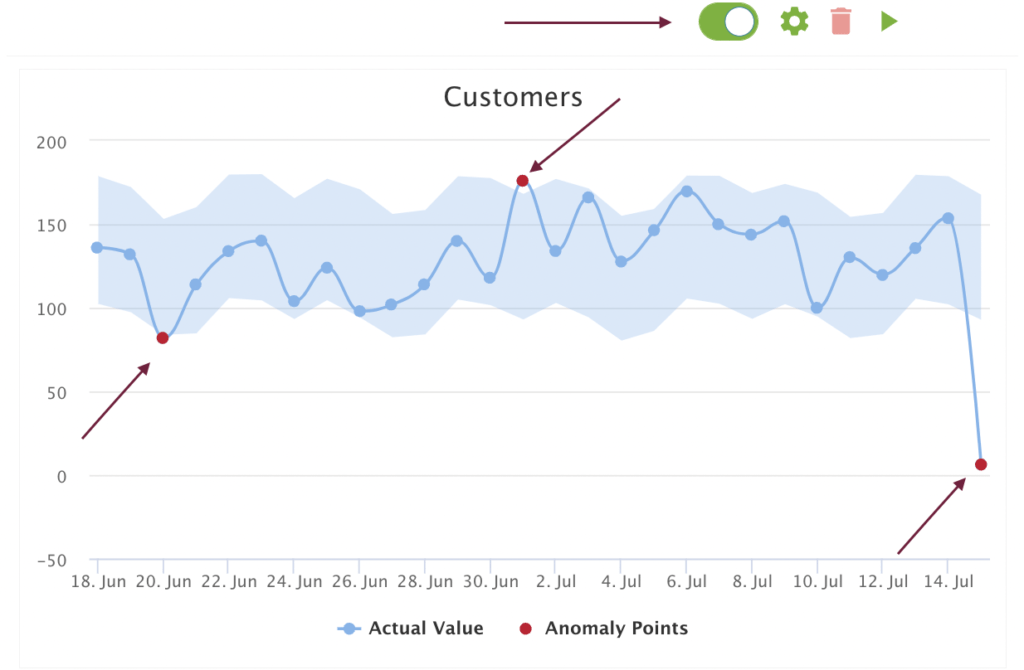
You can use the toggle to switch between a forecast and anomaly detection view. The anomaly points are shown in red, which indicates some anomaly in your business as usual on a certain day.
STEP 9: Create notifications
SageData gives you the option not only to visualize forecasts and anomalies but also to monitor them in real-time, by getting notifications on your email or in a selected Slack channel. This will help you detect and solve issues faster, without losing many conversions.


