
WANT TO LEARN HOW TO DESIGN SUCH BEAUTIFUL REPORTS
YOURSELF?
YOURSELF?
Get our FREE ebook on the best practices in data visualization:


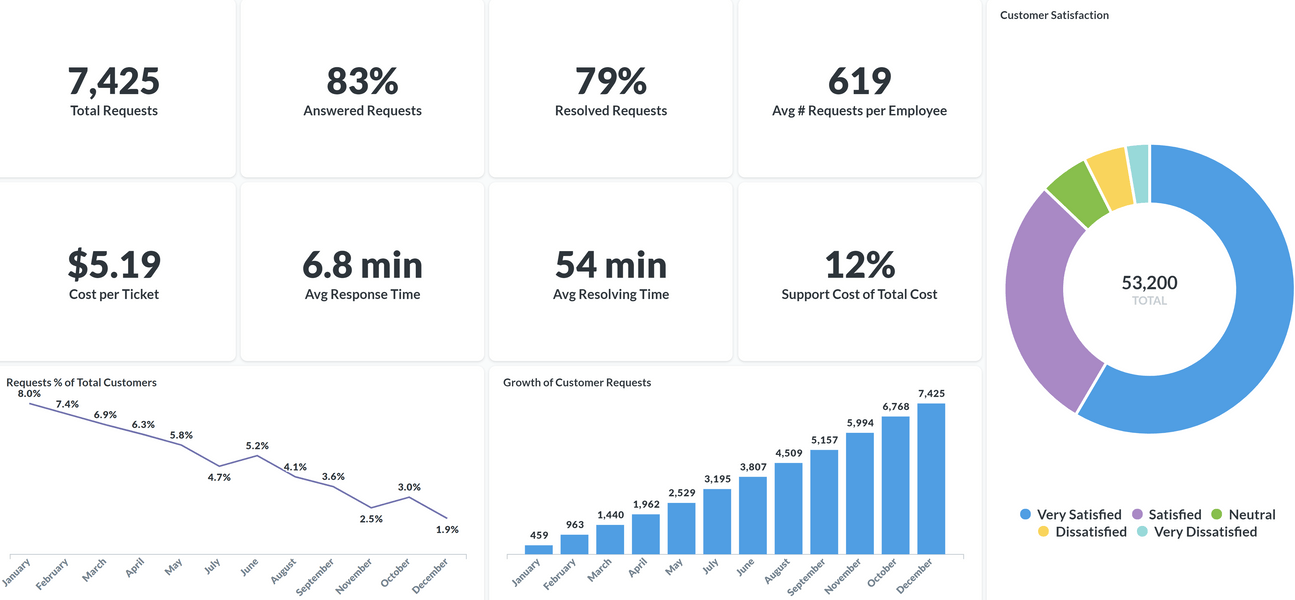
The old adage that ‘the customer is king’ might be banal but it is as true today as it was 100 years ago. Apart from providing a great value by offering a product or a service, an important aspect of customer success and satisfaction is the post-sale communication and care. A Customer Service report from SageData shows several metrics of performance of a customer facing team. One of the most important metrics is the Average Response Time, because quick response to customer requests is essential for great customer satisfaction. The Average Resolution Time is another important metrics that shows end-to-end handling of customer requests. Lengthy resolution times may indicate that the customer success team is struggling with the volume and complexity of customer inquiries.

Answered Requests % – what amount of all requests have been answered and the work for their resolving has been started
Cost-per-Ticket – the average cost (in terms of salary of the employee) for each ticket that was resolved
Support Cost of Total Cost – shows what percent of all cost of the company is the customer support cost
Request % of Total Customers – the percentage of all customers that have filed a ticket/request

Connect to 100+ data sources
such as Facebook, Instagram,
Stripe, Google and many more.

Load the data into your own
Data Warehouse. Run it yourself
or have SageData run it for you.

Easily visualise your data.
Integration-to-Chart time
under 10 minutes!
“Every day that goes by when you do not have accurate data to make decisions, is the day when you use intuition to make decisions”
“Every day that goes by when you do not have accurate data to make decisions, is the day when you use intuition to make decisions”
You need a report for another department? See what else we can do:
Get our FREE ebook on the best practices in data visualization: