SageData platform provides you with a fantastic way to visualise and explore your data without having to invest a lot into managing technology or complicated tools. Our Data Analysts can help you build any report that you need to better understand your business. Here are some of the most frequently used reports for decision making.
General Business KPIs and Metrics Reports
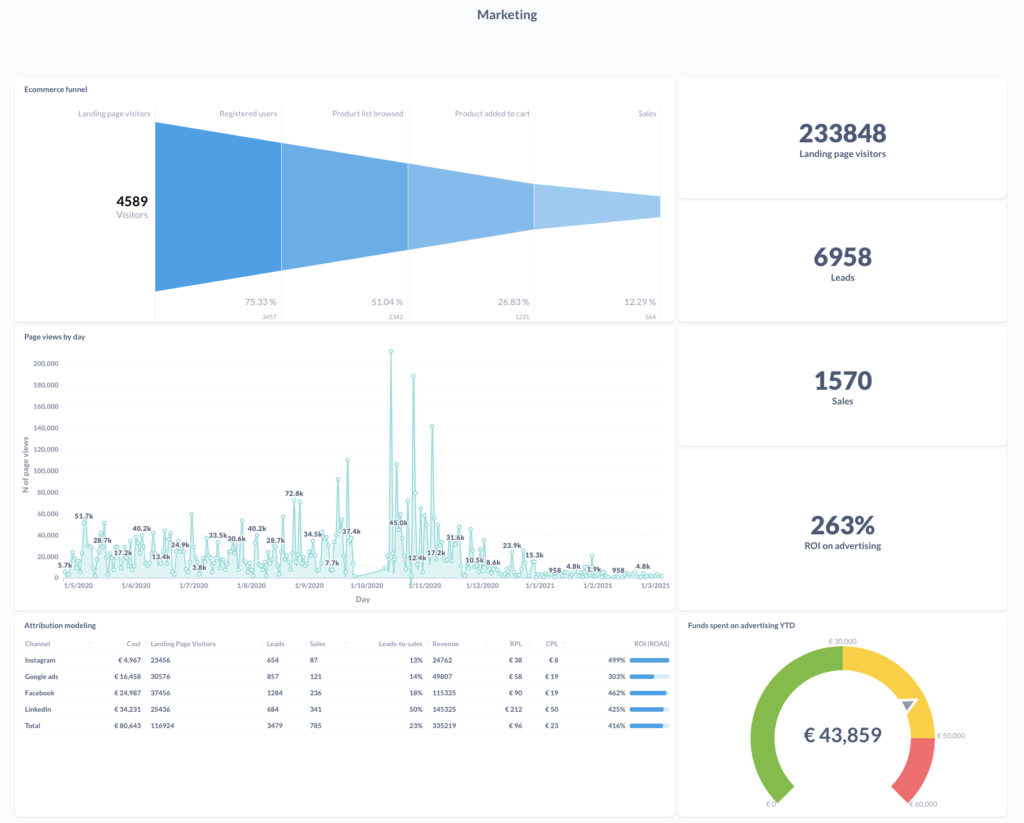
See the traffic in your web or mobile application and visualise standard KPIs and Metrics that help you better understand the trends over time.
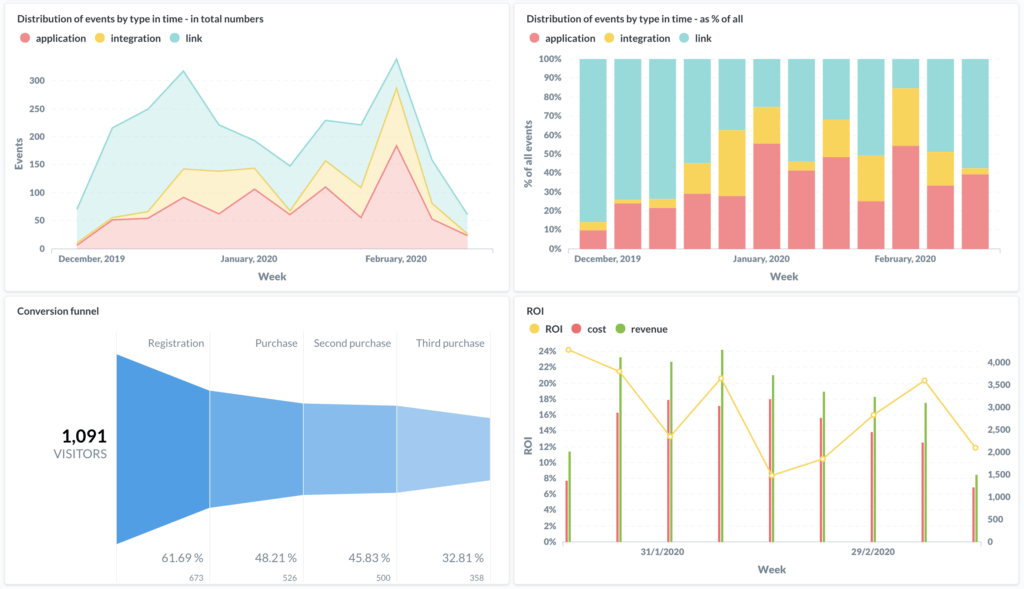
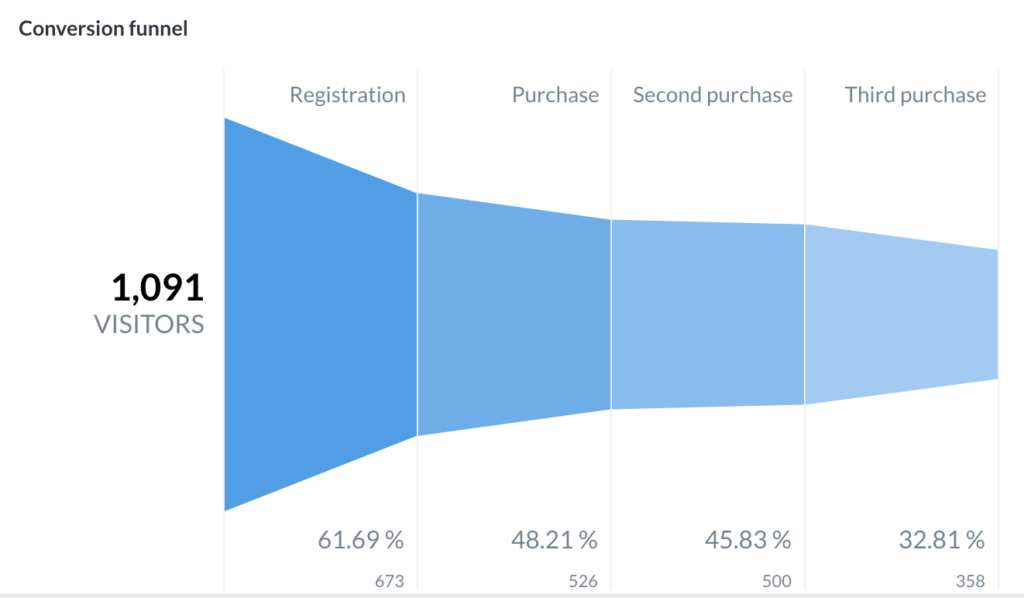
Conversion Funnel Reports
Visualise the journey your visitors take from the visit to purchase and see where you have the biggest drop off in conversion.
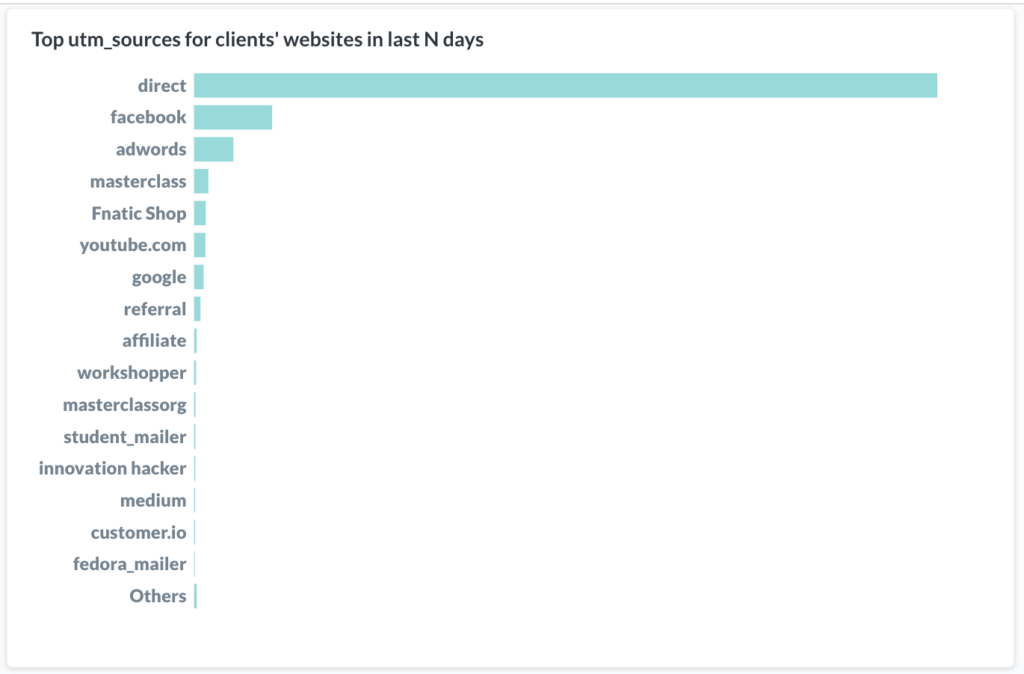
Attribution Modelling Reports
See where most of your users are coming from and compare your cost of acquisition with LTV of each customer to get your ROI% on Marketing expense.
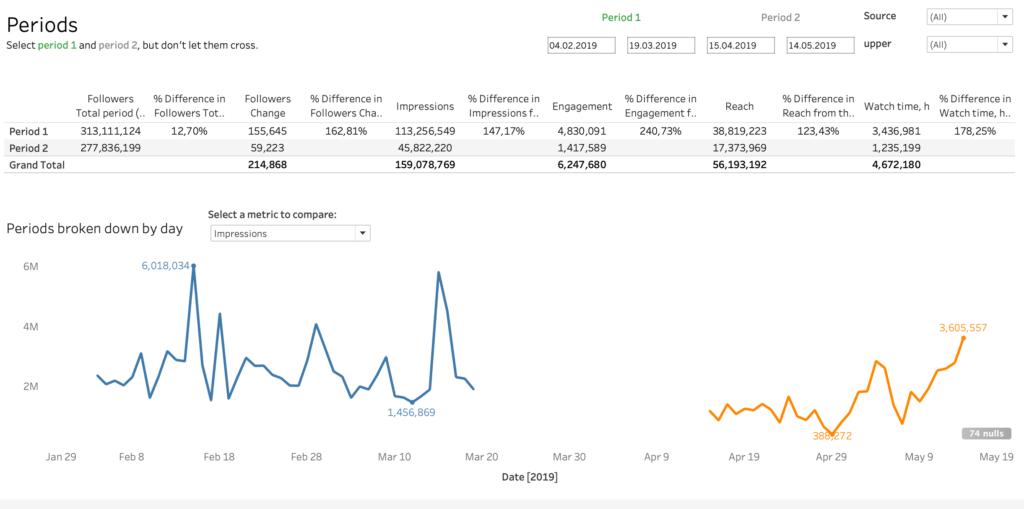
Social Media Analysis Reports
Analyse followers, like, post engagements across multiple Facebook, Instagram, Twitter and YouTube channels.