
What is anomaly detection?
Anomaly detection (outlier analysis) identifies data points, events, and/or observations that differ significantly from a dataset’s normal behavior.
Detecting these anomalies can give you beneficial insights into your company’s business, by either indicating crucial incidents, such as a technical problem, or potential opportunities, such as a change in consumer behavior. This will enable your company to make data-driven business decisions and spot new trends.
What is an anomaly?
Thanks to various management software and analytical programs, companies can much easier measure every aspect of their key business activities. Organizational success can be evaluated based on business KPIs, application operational performance, or even infrastructure components. With a great amount of information that can be acquired through various data sources, companies have an impressive volume of datasets for business analysis at their disposal.
Based on this dataset companies can discover patterns that describe their business as usual. When an unexpected change within these data patterns appears, or an event that destroys this data pattern occurs is considered an anomaly. In short, an anomaly is a deviation from business as usual. 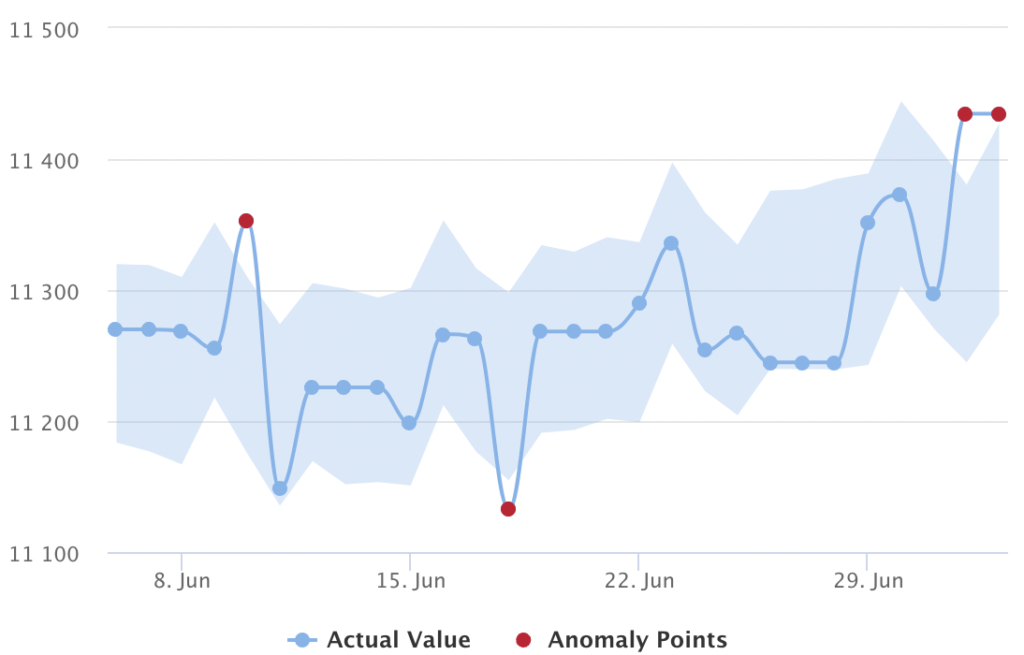
Depending on your business it might be important to track data or try to detect anomalies for valuable metrics such as:
- Daily active users
- Mobile app installs
- Revenue per click
- Volume of transactions
- Average order value
- Web page views
- Cost per lead (CPL)
- Cost per click (CPC)
- Customer acquisition costs
- Bounce rate etc
SageData anomaly detection
Anomaly detection
Within a few easy steps, SageData offers very precise anomaly detection. It enables our business users to spot any unusual patterns, behaviors, or events, by detecting and monitoring recurring events, trends, and correlations from an existing dataset.
Real-time alerts
Having anomaly detection monitoring, would not bring you much, without a mechanism for alerting you, when an anomaly is detected. SageData offers a couple of notification alerts to its users, such as:
- Email alert notifications
- Third-party applications (Slack)
Dashboard
SageData’s anomaly detection includes a configurable dashboard that enables you to display metrics in different ways. You can use the dashboards to visualize your data in real-time.
How to launch SageData anomaly detection?
Sign in
Go to SageData’s login page and log in to your account. Find the Data Science Tab on the left side and click on it.
Note: In order to create new SageData forecast/anomaly monitoring, you should have your data warehouse connected to your account.
Create new anomaly monitoring/forecast
STEP 1: Select metrics
Before creating the anomaly monitoring, you will have to decide which business metrics you want to monitor for changes in business as usual. For example, you can decide to create anomaly detection for
- application performance on the technical/code level
- anomaly detection for product quality (customer buying behavior anomalies)
- anomaly detection for user experience (API errors, load-time glitches, server downtime) etc.
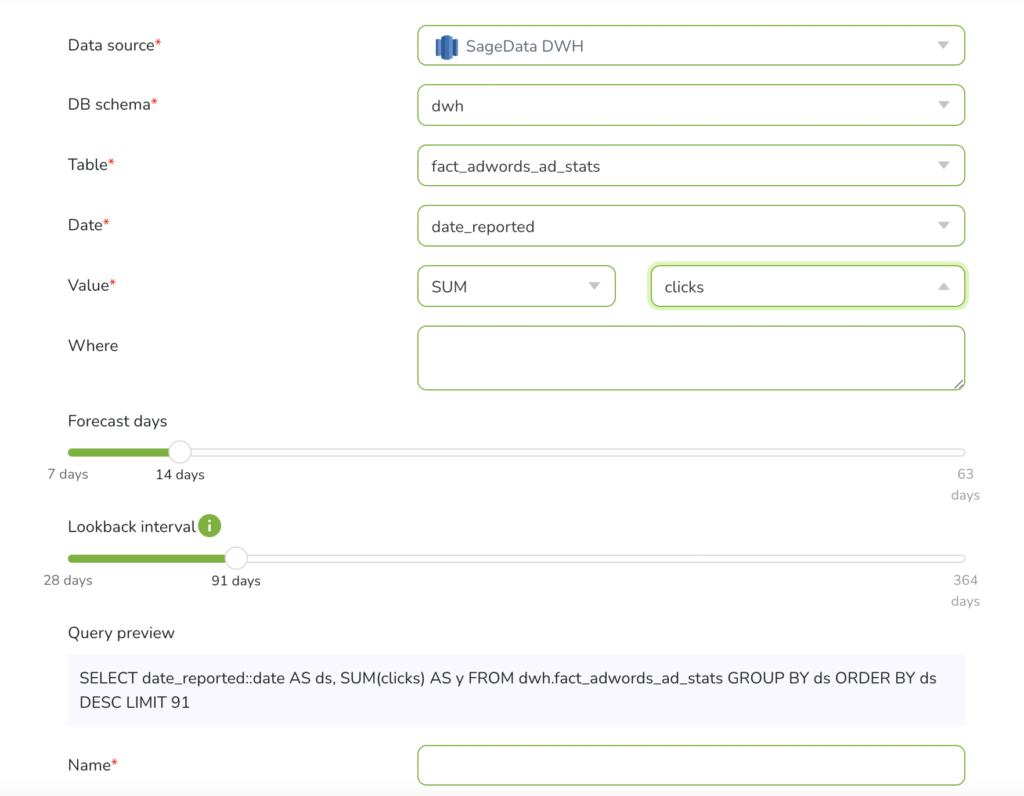
STEP 2: Select table
When creating a new anomaly monitoring/forecast you will have to select the data source, database schema, and table, where the data metrics you want to monitor are located at. The suggested database schemas in the dropdown are loaded based on the source selected, as the tables loaded are based on the database schema selected.
STEP 3: Select Date column
Furthermore, you will have to select the date/ date-time column from your table which will be considered the date range for the trend you want to observe. Usually, it is the timestamp of when the records were created, such as created_at field.
STEP 4: Select value
As next, you will have to decide which is the exact metric that will be an indicator for the anomaly monitoring.
In our example below we will create anomaly monitoring for customer behavior based on AdWords ads statistics and sum of clicks.
STEP 5: Add filters (optional)
You can choose to filter your data and monitor only the subset of your data, such as a particular country. You can use the Query Preview window to see the exact query SageData will run to fetch the data for anomaly monitoring.
STEP 6: Select lookback and forecast interval
As forecast and anomaly detection goes hand in hand, you can select amount of days you want to have your future forecast for, as well as the lookback interval.
Example: Your table consists of data for the past 4 years. One of your most powerful ad campaigns ran in the last month. You would like to understand it and gain insides into it. Then select 30/31 days as a lookback interval. Based on this interval the anomaly monitoring algorithm will decide if something is an anomaly or not.
Note: The longer the lookback interval, the higher the possibility of adding old inaccurate data to the monitoring and forecast. Beware of the accuracy of the historical data in your table for the predictions and monitoring.
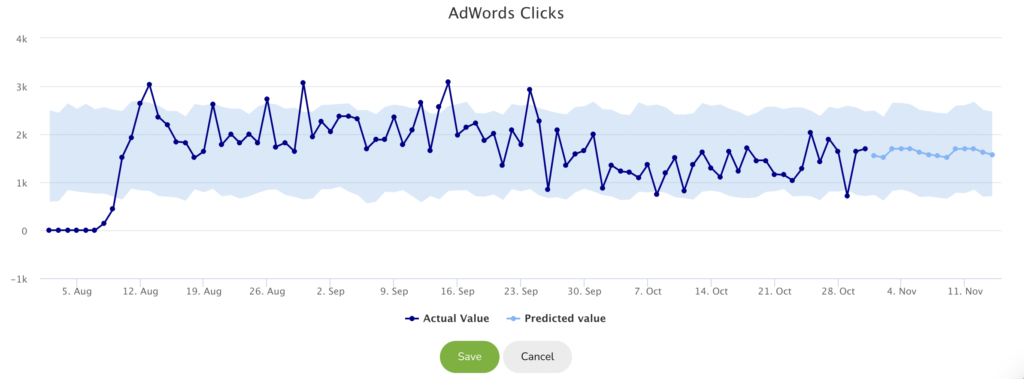
STEP 7: Run
Give a name to your forecast/detection and click on run. Now SageData is collecting the data from the data source based on the date reported and sum the clicks for the selected interval and will try to find anomalies. You will see a graph that visualizes your actual data and the forecasted data.
Only after you click on save, the anomaly/forecast graph will be shown on your Dashboard.
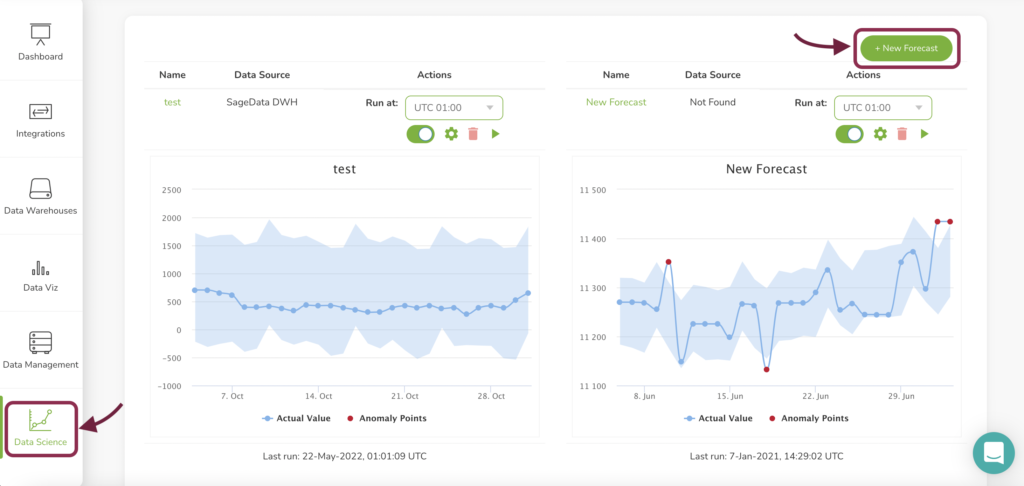
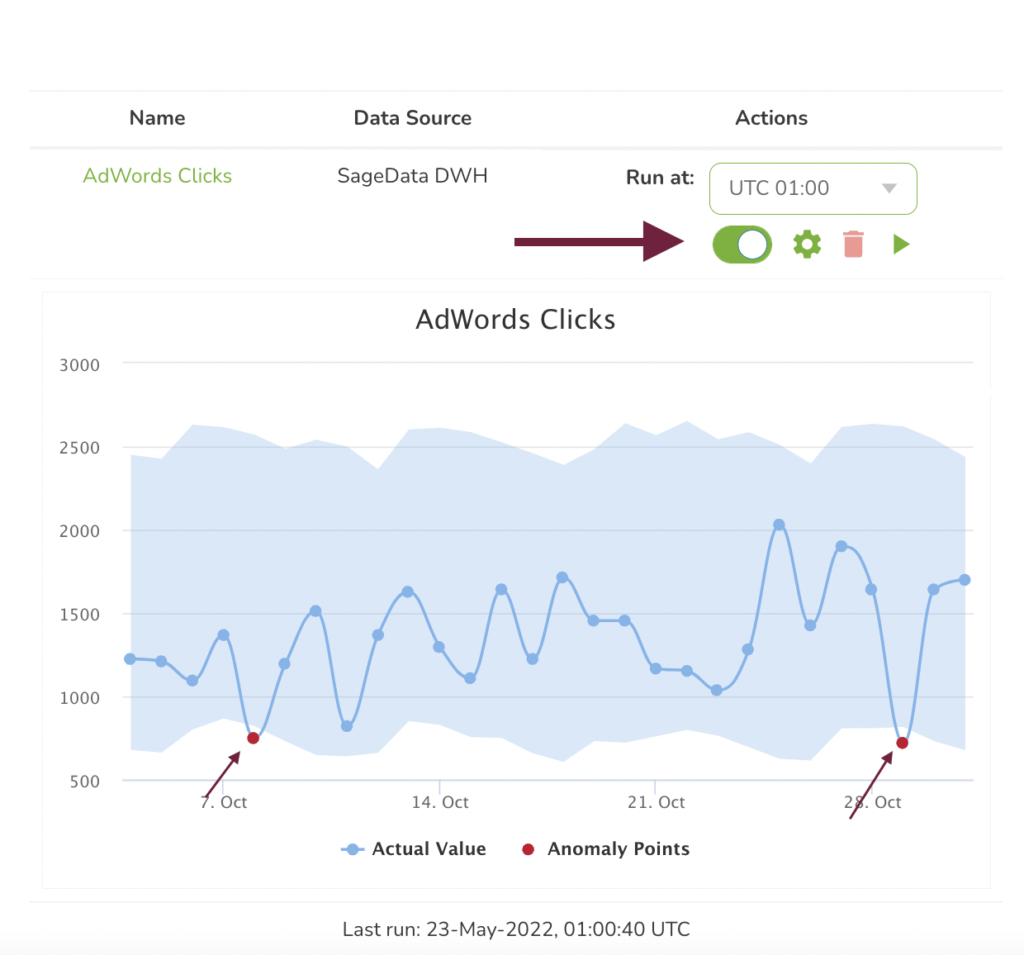
STEP 8: Manage dashboard
After SageData has created and saved your forecast, it will be shown on the dashboard of the Data Science section.
You can use the toggle to switch between a forecast and anomaly detection view. The anomaly points are shown in red, which indicates some anomaly in your business as usual on a certain day.
STEP 9: Create notifications
SageData gives you the option not only to visualize anomalies but also to monitor them in real-time, by getting notifications on your email or in a selected Slack channel. This will help you detect and solve issues faster, without losing many conversions.
