Preply and SageData Case Study
Great variety of custom integrations and extremely fast technical support.
Talks to us to become data-driven:


Industry: E-Learning/EdTech
Preply is a reputable online tutoring platform and teacher marketplace that delivers over 300,000 lessons a month for around 100 subjects, including languages and hobbies. Over 140,000 tutors from more than 200 countries are offering their services worldwide.
TechStack:

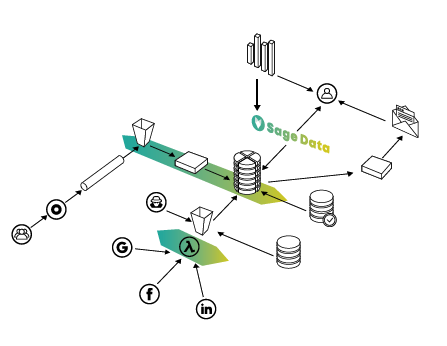
Preply was generating a huge amount of data sets on a daily basis, which needed structuring and some cleaning up. Furthermore, new integration set was needed rapidly and within a few hours.
✗ data warehouse – missing data warehouse as single source of truth
✗ ETLs (Extract, Transform, Load) – not existing ETLs practices, in order to take data from one system, transform it, and load it into the organization’s data warehouse
✗ data pipelines – lack of pipelines for automated transfer of data from one system to another
✗ data visualiastion – important metrics and KPIs were not visualized in a comprehensive way
Preply needed a partner, who reacted fast and immediate to each integration requirement and technical/business intelligence support on daily basis.
At the time, Preply had a relatively small Data team. While they were looking for the talent to fill in their data ranks, the SageData team stepped in to design their Data Warehouse architecture and orchestrate the data pipelines. First and main task for SageData was to align clarify and align all important metrics and KPIs with the management team, crucial to Preply’s business.
Furthermore, we have created crucial business visualisation reports, which helped management spot anomalies on the spot.
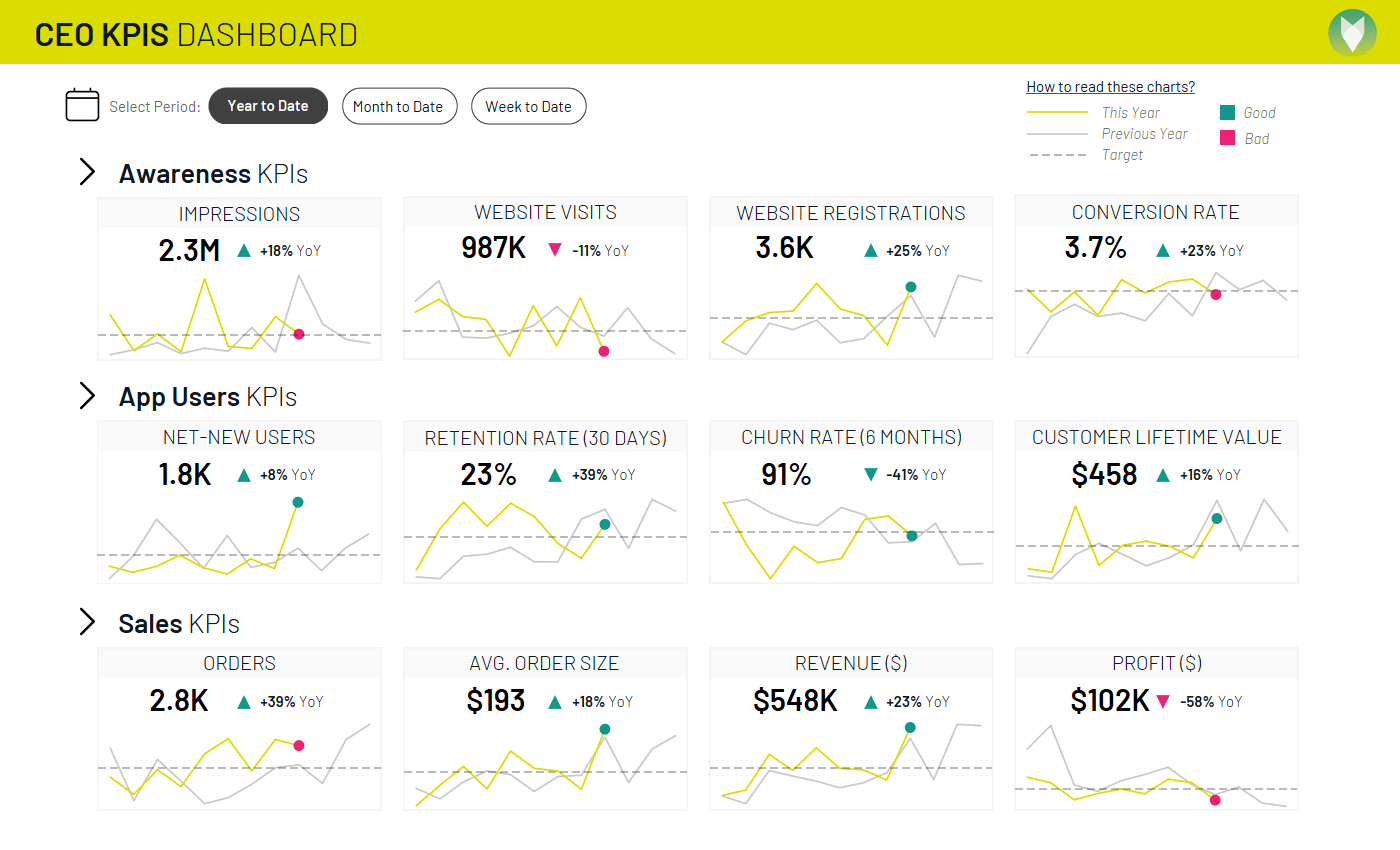
KPIs and Metrics, North Star, Trends, Budgets and Forecasting, we do it all. SageData team helps you collect data, transform it and create insightful reports.
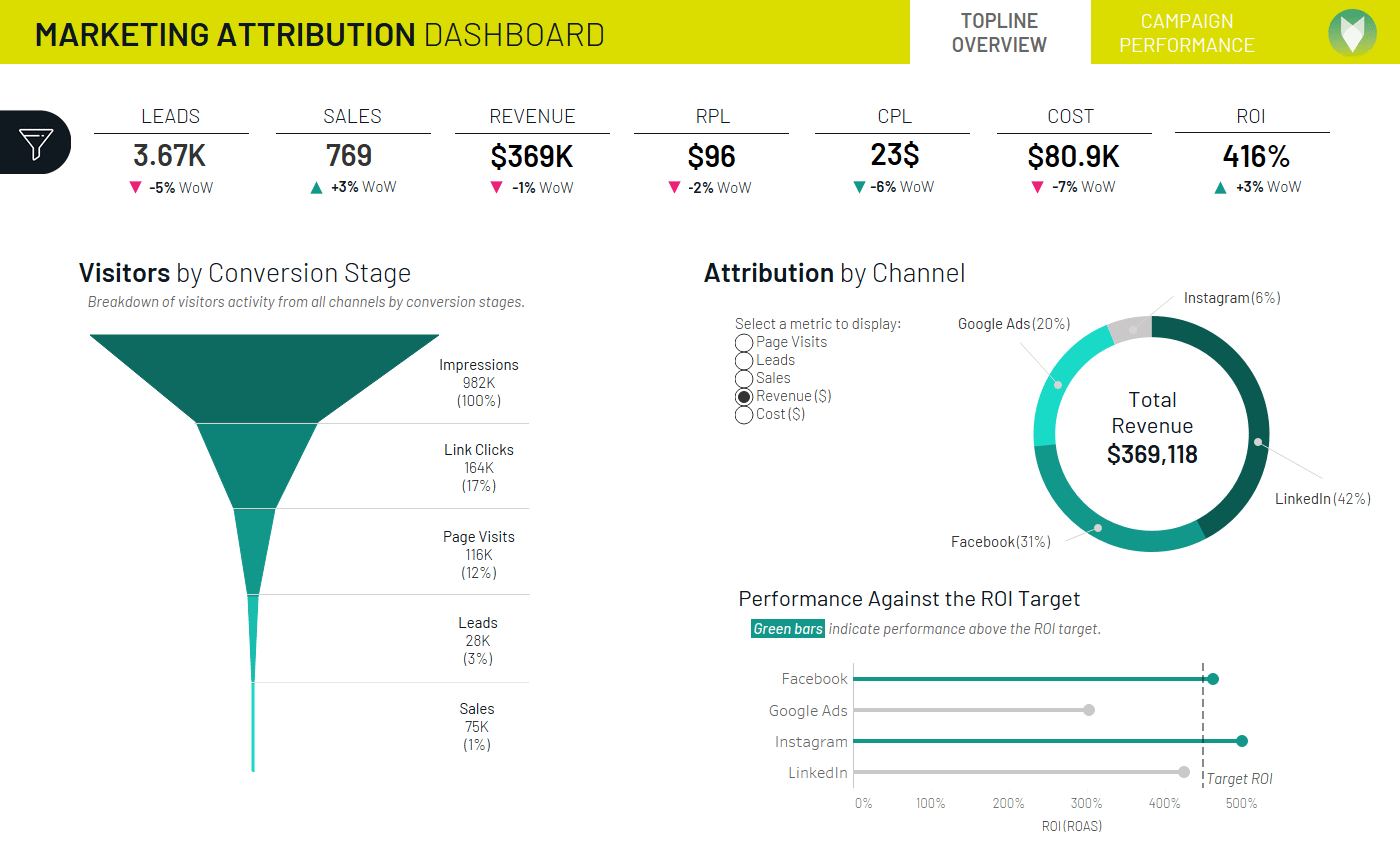
Marketing Attribution and Customer Journey Analytics. SageData team helps you collect data, transform it and create insightful reports.
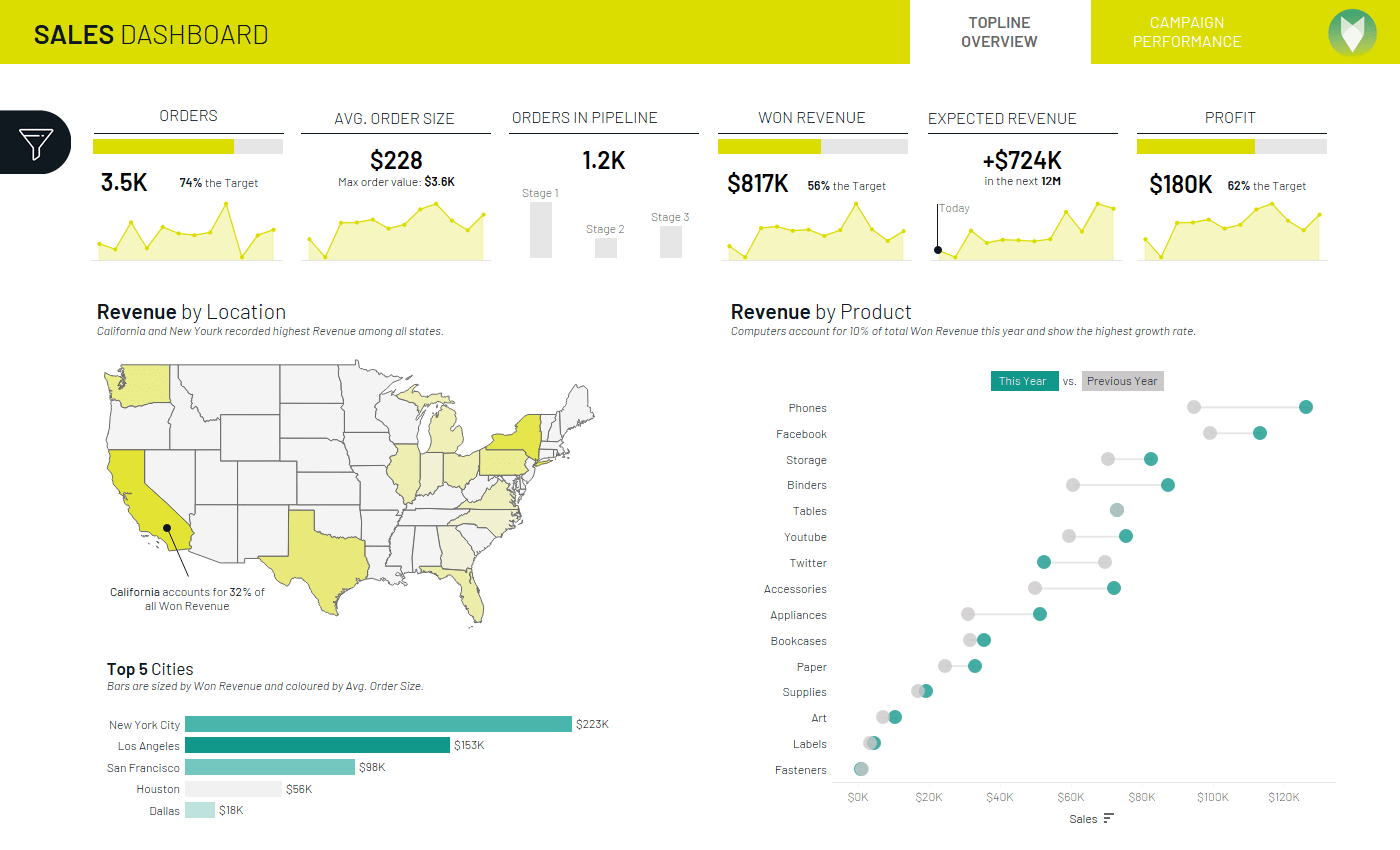
Sales reports can group the revenue by geography, product, customer segment. Great for companies who started to expand into new markets
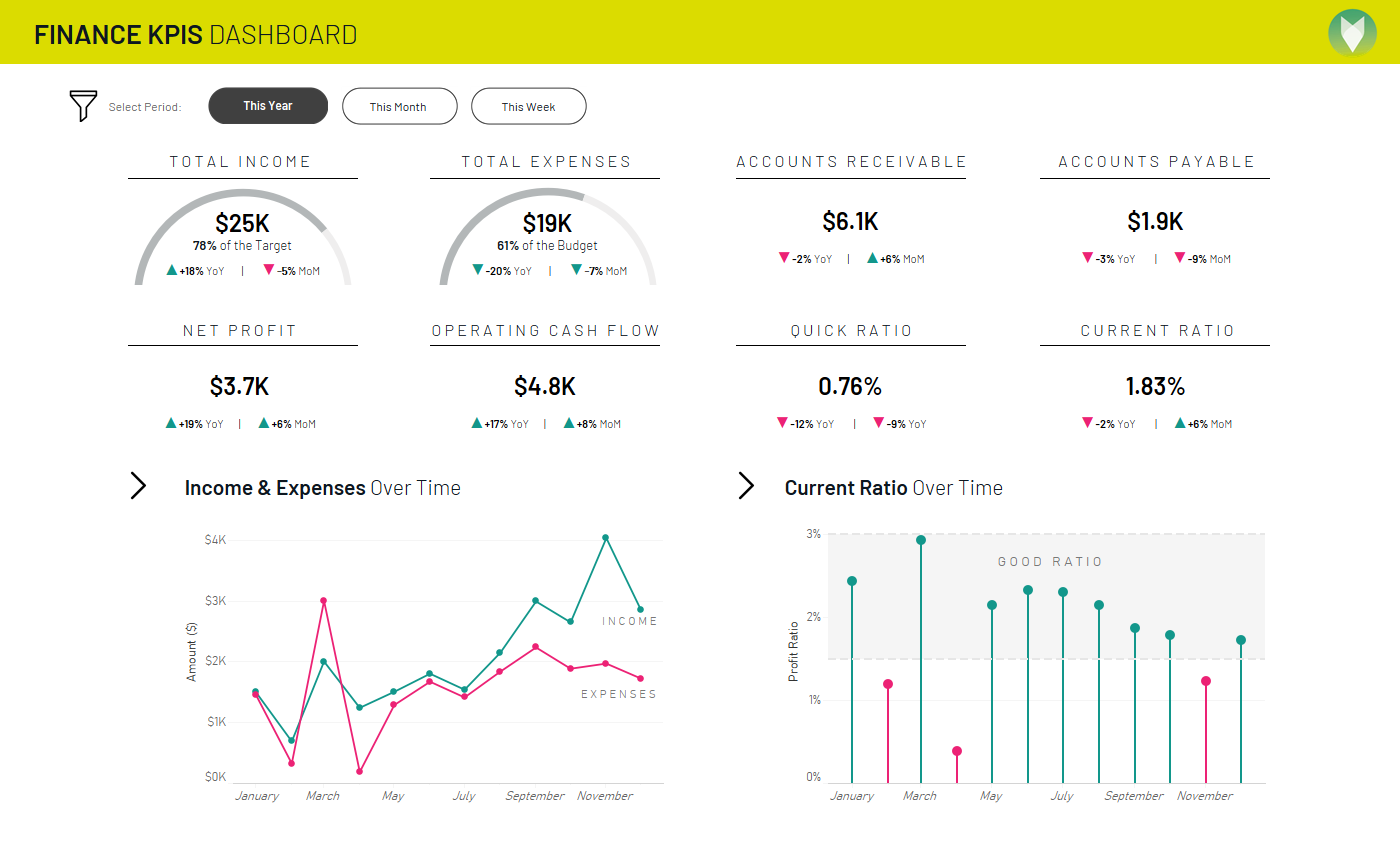
Finance metrics show overall health of the company and compare trends to the budgets and forecasts.
Preply has now generated over 300 million rows of data wih SageData. A huge variety of custom integrations were created on the spot, sometimes within hours. Preply received an outstanding around the clock BI and technical support. The BI platform created by our SageData’s team was then continuously scaled and upgraded by Preply’s internal Data Team.
At SageData you always own your data, we help you make sense of it
We spend time with you and your stakeholders in order to understand what is important to you and how you look at your business. We ensure that everyone speaks the same data-language by consolidating KPIs, their definition and formulas.
We deconstruct your KPIs into the relevant data components and link them back to the data sources.
We establisht he data granularity so you always have the lowest level of drill down available to your teams.
Our engineers work with your Data Teams to establish the best data engineering practices and create an architecture that will be easy to maintain and scale.
The Data Analysts in SageData team will set up data modeling processes that will efficiently transform and aggregate your data.
Our team will seet up the tests and checks to validate the data before your reports are updated so you have complete trust that your analytics are always accurate.
We train your teams on the best data practices and methodologies to ensure that our collective knowledge is used to support your business in the future.
Our goal is to ensure that your teams are well equipped to analyse the data and get the needed insights will into the future.
Connect to 100+ data sources such as Facebook, Instagram, Stripe, Google and many more.
Load the data into your own Data Warehouse and apply your KPIs and Metrics.
Easily visualise your data. Integration-to-Chart time under 10 minutes!