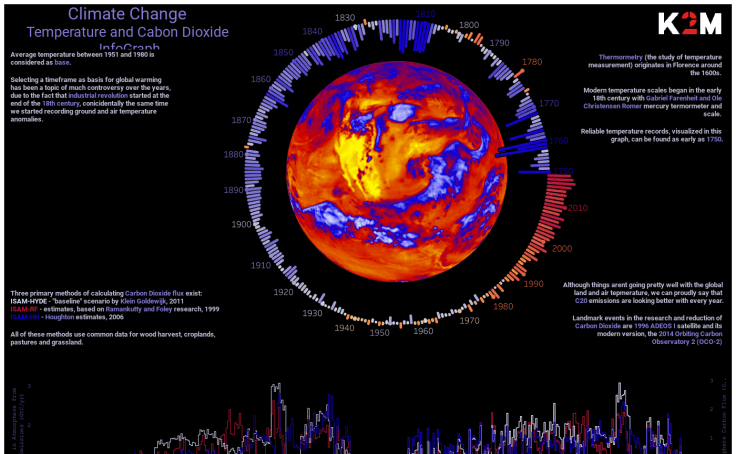
Scientific Data Analysis Software
Scientific Data Analysis Software
Benefits of Having Scientific Data Analysis Software for your Business

Scientific Data Analysis software is helpful for businesses as it describes the process of systematically applying statistical and logical techniques to illustrate, analyze and evaluate information. It makes the information accessible, easy to understand, and fully transparent.
Scientific Data Analysis software helps small businesses, startups, and established companies and organizations. Having so much control over your analyzed information allows you to set achievable goals, make informed decisions, and generally run your business better. All of these three are the keys needed to increase your employees’ productivity and motivation.
Scientific Data Analysis software gives you a very much-needed insight into how well you, or your managers, are running your business, how close you are to achieving your goals, and what are the things that may need additional changes to optimize results.
- Relying on Scientific Data Analysis software is mandatory for any business as it:
- Gives you access to real-time data from any device and any point of the world;
- Gives you a possibility to share your reports with your employees or clients;
- Helps you create a clear, accurate, and engaging representation of your data with the help of different visual elements;
- Provides end-to-end analytics for all available information.
Why a Complete Business Intelligence Solutions is Best
Business Intelligence solutions help you run your business better and more smoothly. SageData provides BI for startups and already established organizations.
What makes our solutions preferable among our clients is that they are entirely customizable to meet the needs of any business.
This means that SageData’s Business Intelligence Solutions are also 100% applicable to the scientific industry, the retail industry, the health and pharmaceutical industry and so on.
Some crucial benefits you would get are:
- An impeccable team of professionals – DataAnalysts, Data Warehouse Architects, Marketing Analysts, and Data Engineers with over 20 years of experience in the field will guide you every step of the way.
- Fully Managed Data Warehouse – It is personalized, specifically tailored to your business needs, and fully managed! You also get to upload your very own Data Warehouse if you already have one.
- 140 Data Integrations – Plenty of sources to help pull out the most relevant of your data.
- Access to a variety of software – Event Tracking Software, Predictive Analytics Software, Management Reporting Software, KPI Dashboard Software, Scientific Data Analysis Software, etc.
- Customizable KPIs – You decide what the most crucial KPIs for your business are, and you get to arrange them in your very own KPI Dashboard.
- Marketing attribution – allows you to connect your CPC costs with your conversions.
- Social Media Engagement – Gives you a possibility to track how engaging your social media content is among visitors.
How BI Software Works
Before a solution is delivered to you, your data goes through three different stages:

Data Collection
Our Data Integrations pull out data from all of your business platforms and sources. They then transfer it to your specifically developed Data Warehouse.

Data Manipulation
After the collection is completed, analyses begin. Cohort Analysis, Data Aggregation, Forecasting, and Anomaly Detection are just some of the processes that take place during this stage.

Data Visualization
Your analyzed information needs to be turned into reports. You get access to plenty of visual elements that are fully customizable to correspond with your brand identity while helping you to create engaging reports.
Frequently Asked Questions
While Excel offers many great functions, it cannot be of much help in the analysis of long spreadsheets of data. The experience is difficult and not user-friendly. However, Scientific Data Analysis software helps you analyze big amounts of data while it also saves a lot of your time.
Reports are crucial for understanding information and statistics. They create a visually pleasing layout of your data that is easy to read and helps readers understand all of the information profoundly. A good report can eliminate all possibilities for misunderstandings.
Many methods take part in analyses processes:
- Statistical analysis;
- Descriptive analysis;
- Diagnostic analysis;
- Predictive analysis;
- Prescriptive analysis.
Data analysis in business helps you understand all problems your organization may face. It also explores data in meaningful ways helping you better understand your business and improve your business strategy and goals. It increases productivity and motivation among employees.
